. 2020 Oct 26;12(1):247–252. doi: 10.1039/d0sc04316h

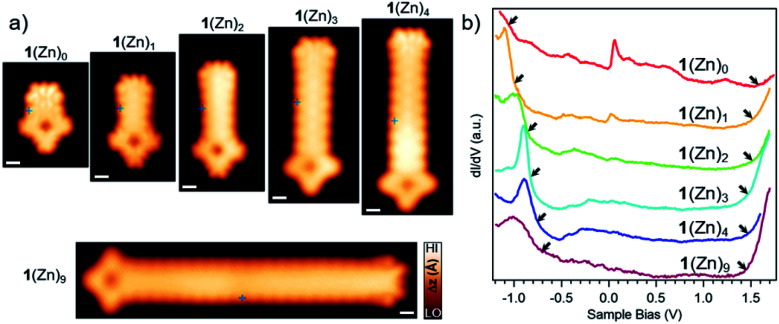
Fig. 3. (a) Close-up STM images of GNR-Por hybrids 1(Zn)0–1(Zn)4 (from left to right: Vs = −0.1 V, It = 230 pA; Vs = 0.45 V, It = 480 pA; Vs = 0.48 V, It = 450 pA; Vs = −0.2 V, It = 150 pA; Vs = −0.2 V, It = 250 pA) and 1(Zn)9 (Vs = −0.06 V, It = 200 pA). For overview STM image for 1(Zn)9 see Fig. S2.9. Scale bar: 5 Å. (b) dI/dV spectra recorded at the central region of the GNR segment in hybrids 1(Zn)0–1(Zn)4 and 1(Zn)9 (spectra acquisition positions marked in the STM images in a). For each spectrum, the left arrows indicate the position of the valence band maximum as determined from the half-maximum position in the raising slope of the corresponding peak, the right arrows indicate the onset of the CBM as determined by the intersection of the linear slope with the baseline.

Fig. 3