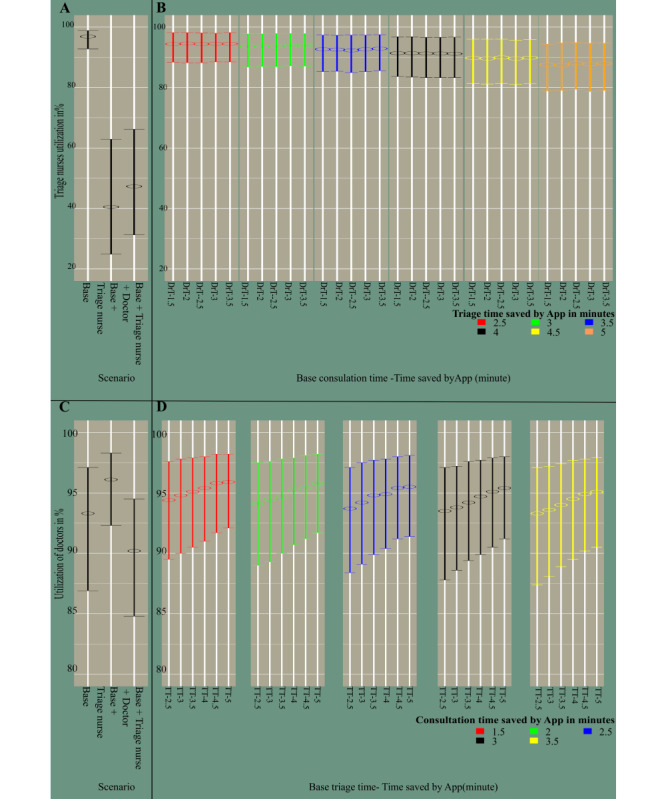
Figure 2.

Utilization of triage nurses (A and B) and doctors (C and D) in percentage. A and C represent the idle time of the staff in scenarios where no app is used, which is the baseline case setting, and in scenarios with extra staff. B and D indicate the idle time of triage nurses and doctors in 30 different scenarios combining different time savings by the app in the triage and consultation processes. In B, the X-axis labels show triage time as the baseline triage time (TT) subtracted by time saved by the app (2.5, 3, 3.5, 4, 4.5, and 5 minutes). In D, the X-axis labels show the consultation time as the baseline doctor’s consultation time (DrT) subtracted by the time saved by the app (1.5, 2 ,2.5, 3, and 3.5 minutes).
