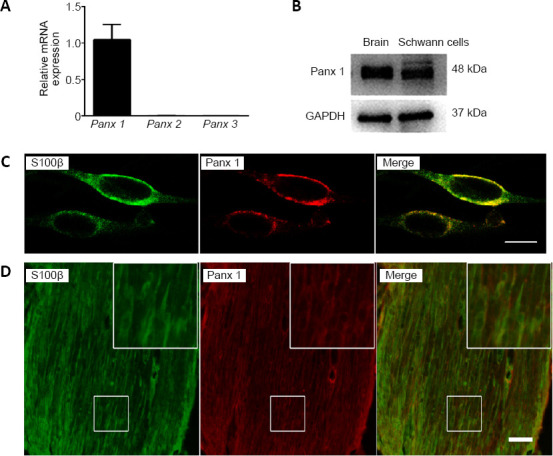
Figure 1.

Expression of Panx 1 in Schwann cells.
(A) mRNA levels of Panx in Schwann cells. Data are expressed as the mean ± SEM (n = 4) and were analyzed by one-way analysis of variance or Student’s t-test. (B) The Panx 1 protein level in Schwann cells is shown; mouse brain tissue was used as a positive control. (C) Double immunostaining images show that Panx 1 (red, stained by Cy3) is expressed in cultured Schwann cells, as shown by the presence of S100β (green, stained by Alex-488). (D) Example images show double immunostaining with S100β (green, stained by Alex-488) and Panx 1 (red, stained by Cy3) in mouse sciatic nerves. The insets showing the boxed areas at higher magnification. Scale bars: 20 μm in C, 50 μm in D. GAPDH: Glyceraldehyde 3-phosphate dehydrogenase; Panx: pannexin.
