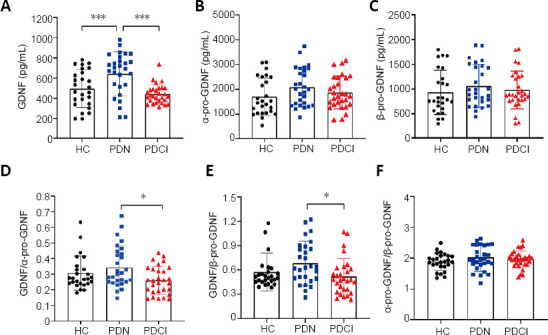
Figure 2.

Comparison of levels of GDNF and its precursors between the three groups.
(A–C) Levels of GDNF (A), α-pro-GDNF (B), and β-pro-GDNF (C) among the three groups. (D–F) Ratios of GDNF/α-pro-GDNF (D), GDNF/β-pro-GDNF (E), and α-pro-GDNF/β-pro-GDNF (F) among the three groups. n = 26 (HC), 26 (PDN), and 27 (PDCI). The three groups were assessed using one-way analysis of variance followed by post hoc testing: Dunnett’s T3 test (GDNF, α-pro-GDNF/β-pro-GDNF) or the least significant difference method (α-pro-GDNF, β-pro-GDNF, GDNF/α-pro-GDNF, GDNF/β-pro-GDNF). *P < 0.01, ***P < 0.001. GDNF: Glial cell line-derived neurotrophic factor; HC: healthy control; PDCI: Parkinson’s disease with cognitive impairment; PDN: Parkinson’s disease with normal cognitive function.
