. 2020 Oct 22;12(1):148–157. doi: 10.1039/d0sc04983b

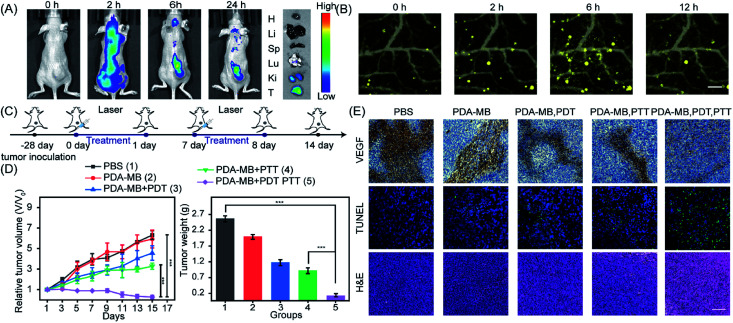
Fig. 8. In vivo therapeutic performance of PDA–MB for multimodal imaging-guided inhibition of tumor growth. (A) Time-dependent in vivo fluorescence images of tumor-bearing mice that received intravenous injection of PDA–MB. The ex vivo fluorescence images of major organs and tumor were acquired from the mice at 24 h post-injection of PDA–MB. (B) In vivo dual-wavelength photoacoustic images of blood vessels (523 nm) and PDA–MB (744 nm). Scale bar, 1 mm. (C) Schematic illustration of the experimental design for phototherapy. (D) Inhibition of tumor growth with PDA–MB. Left, time-dependent tumor volume changes after different treatments. Right, average weights of tumors. (E) VEGF, TUNEL, and H&E staining of tumor sections harvested from mice with different treatments at 15th day. Scale bars, 200 μm. Data are shown as mean ± S.D. (n = 5). P values were calculated using two-tailed Student's t-test (***P < 0.001, **P < 0.01, or *P < 0.05).

Fig. 8