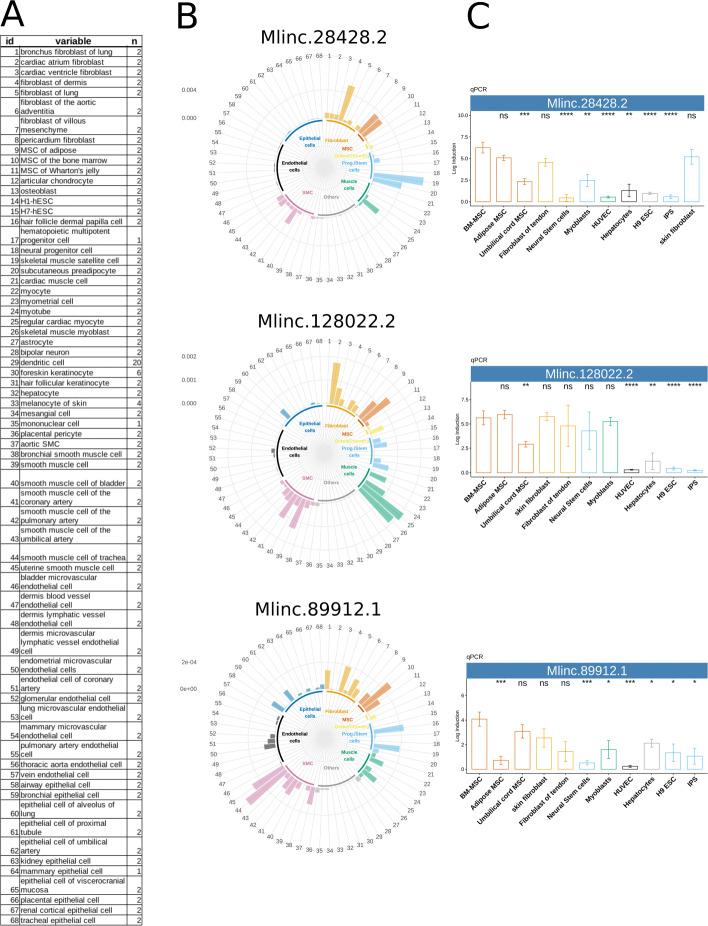
Fig. 4.
High throughput exploration of selected candidates across a variety of samples by k-mer quantification in RNAseq and biological validation by RT-qPCR. a List of tissues for the cell specific expression exploration (samples with ID numbers are listed in Additional file 8) b Relative expression of Mlinc.28428.2, Mlinc.128022.2, and Mlinc.89912.1 across ENCODE’s ribodepleted RNAseq data, made by k-mer quantification, normalised by k-mer per million. c qPCR relative quantification was performed on the selected 3 Mlincs in MSC of different origins (BM-MSC, Ad-MSC, Umbilical cord msc) and other indicated cell types. Relative quantification (Log induction) was quantified by ddCt method using non MSC types as calibrator (mean of triplicates). Student tests have been made between triplicates, each test using BM-MSCs as reference group (ns: P >0.05, *: P ≤0.05, **: P ≤0.01, ***: P ≤0.001, ****: P ≤0.0001)

