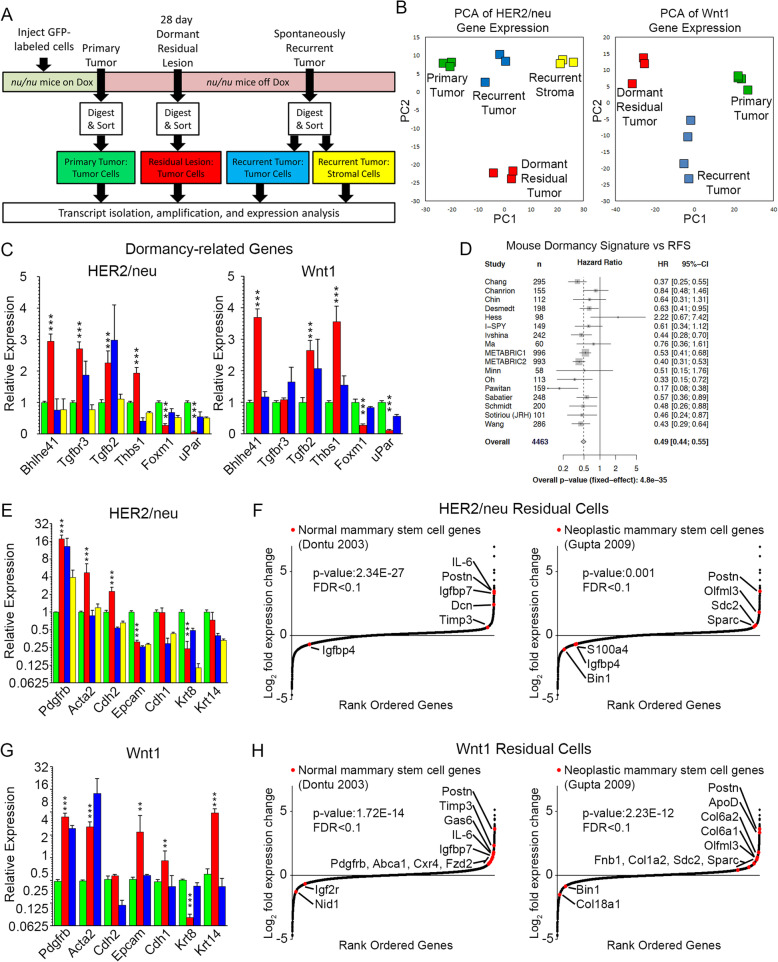
Fig. 4.
Residual tumor cells express genes associated with EMT and mammary stem cells. a Schematic for isolation and analysis of primary tumor cells (green), dormant residual tumor cells (red), recurrent tumor cells (blue), and stromal cells from recurrent tumors (yellow). b Dot plot showing first (PC1) and second (PC2) principal components from analysis of gene expressed in sorted primary tumor cells, dormant residual tumor cells, and recurrent tumor cells from HER2/neu-Prim1 (left) and Wnt1-Prim1 (right) models. c, e, g Bar graphs showing mean expression level and standard error of the mean (SEM) in primary tumor cells (green), dormant residual tumor cells (red), recurrent tumor cells (blue), and stromal cells from recurrent tumors (yellow), for genes associated with candidate dormancy regulatory genes (c), or epithelial and mesenchymal phenotypes (e, g) for HER2/neu (e) or Wnt1 (g) models. d Forest plot showing hazard ratio of recurrence-free survival (RFS) for patients with high dormancy signature scores across seventeen human primary breast cancer data sets. f, h Dot plot showing rank-ordered log2 fold-change of gene expression in residual tumor cells vs. all other cells for HER2/neu (f) and Wnt1 (h) models. Genes from expression signatures for normal mammary stem cells (left) or neoplastic mammary stem cells (right), which also met criteria for differential expression in their respective datasets (|fold-change| > 1.5, FDR < 0.1), are indicated in red. Genes from these signatures that did not meet criteria for differential expression are not listed. *p value residual tumor cells vs. primary tumor cells < 0.05, **p value residual tumor cells vs. recurrent tumor cells < 0.05

