. 2020 Nov 4;12(2):639–649. doi: 10.1039/d0sc04856a

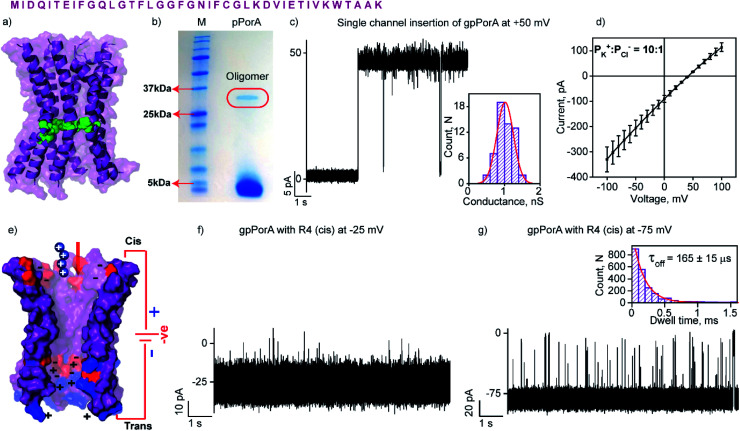
Fig. 1. Structure and electrical properties of pPorA. (a) The sequence of pPorA and electrostatic distribution of modeled pPorA in deep purple colour. Cysteine residues are shown in green. (b) The pPorA peptides run on an SDS-PAGE showing the oligomers. (c) Electrical recording of a gel extracted single pPorA insertion (gpPorA) at +50 mV and unitary conductance histogram obtained by fitting the distribution to a single Gaussian (n = 70). (d) Reverse potential obtained from the IV curve of a single gpPorA pore. (e) Model showing the interaction of tetraarginine (R4) with the cis side. Positively charged residues are shown in blue and negatively charged residues in red. (f) Electrical recordings showing R4 interaction with single gpPorA (10 μM, cis) at −25 mV and (g) −75 mV. Inset, recording at expanded time scale and the corresponding τoff dwell time histogram. Electrolyte: 0.15 M KCl, 10 mM HEPES, pH 7.4. The current signals (c and d) were filtered at 2 kHz and sampled at 10 kHz. The current signals (f and g) were filtered at 10 kHz and sampled at 50 kHz.

Fig. 1