. 2020 Nov 4;12(2):639–649. doi: 10.1039/d0sc04856a

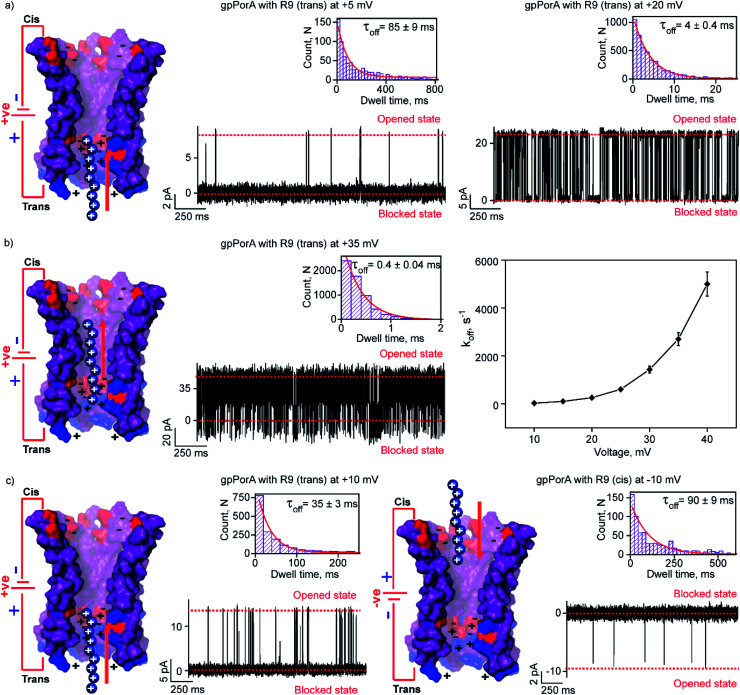
Fig. 4. Interaction of nonaaarginine with the trans and cis side of the gpPorA. (a) Electrical recordings showing R9 interaction with single gpPorA (0.5 μM, trans) at +5 mV and +20 mV. (b) Electrical recordings showing R9 interaction with single pPorA (0.5 μM, trans) at +35 mV and a plot of koffversus the applied voltage (mean values (±s.d.) from three independent experiments are shown). (c) Electrical recordings showing R9 interaction with single gpPorA (0.5 μM, trans) at +10 mV and (0.5 μM, cis) at −10 mV inset, recording at expanded time scale and the corresponding τoff dwell time histogram. Model showing the interaction of R9 with the trans side and cis side of the pores is shown. Electrolyte: 0.15 M KCl, 10 mM HEPES, pH 7.4. The current signals (a and c) were digitally filtered at 1 kHz, (b) +35 mV at and 7 kHz using an 8-pole Bessel digital filter.

Fig. 4