. 2020 Nov 18;12(2):626–631. doi: 10.1039/d0sc05447j

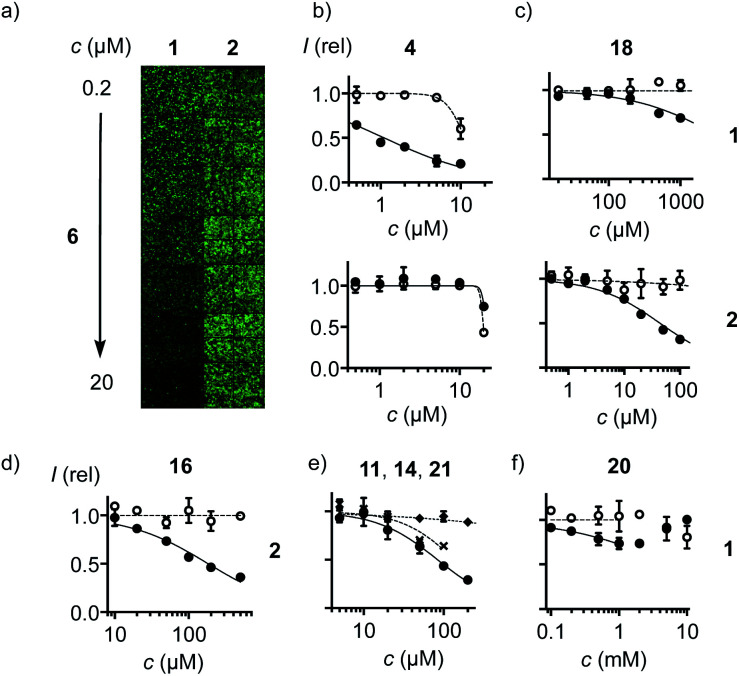
Fig. 3. (a) Fluorescence image of HCHT plates (4 images per well) with HeLa cells pre-incubated with 6 (30 min) followed by co-incubation with 1 (left) and 2 (right, 10 μM each) for constant 30 min. (b–f) HCHT data showing relative fluorescence intensity (filled symbols) and cell viability (empty symbols) of HeLa cells after (b) pre-incubation with 4 for 1 h, followed by washing and incubation with 1 (top), or pre-incubation with 4 for 30 min, followed by co-incubation with 4 and 2 (bottom). (c) As in (b) with 18. (d) As in (b) after incubation for 4 h with 16 followed by incubation with 2. (e) As in (b) after pre-incubation with 11 (circles), 14 (crosses), or 21 (diamonds) for 15 min, followed by washing and incubation with 1. (f) As in (b) after pre-incubation with 20 (30 min), followed by washing and incubation with 1.

Fig. 3