. 2020 Oct 30;12(2):730–741. doi: 10.1039/d0sc04871b

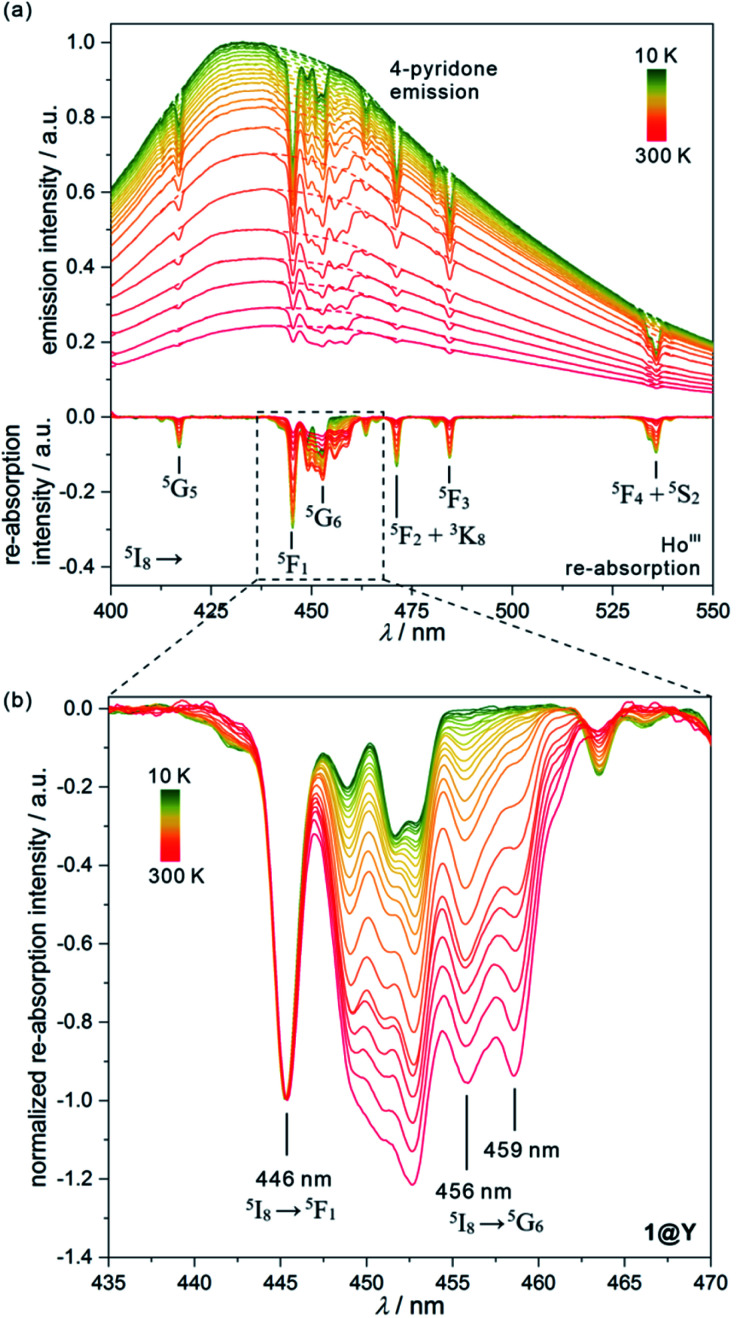
Fig. 4. Temperature-dependent emission spectra of 1@Y measured under 370 nm light irradiation along with the extracted luminescence re-absorption spectra obtained after the subtraction of the ligand emission component (a), with the enlargement of the re-absorption spectra in the range of 435–470 nm showing the strongest thermometric effect (b). In (a), top part, the dashed lines represent the simulated shape of each ligand emission band, while in the bottom part, the assignment of main re-absorption peaks to the electronic transitions of HoIII was shown. The spectra in (b) were normalized to the re-absorption peak at 446 nm. The indicated peaks at 446, 456, and 459 nm were used in the thermometric parameters.

Fig. 4