. 2020 Dec 8;12(5):1803–1809. doi: 10.1039/d0sc04977h

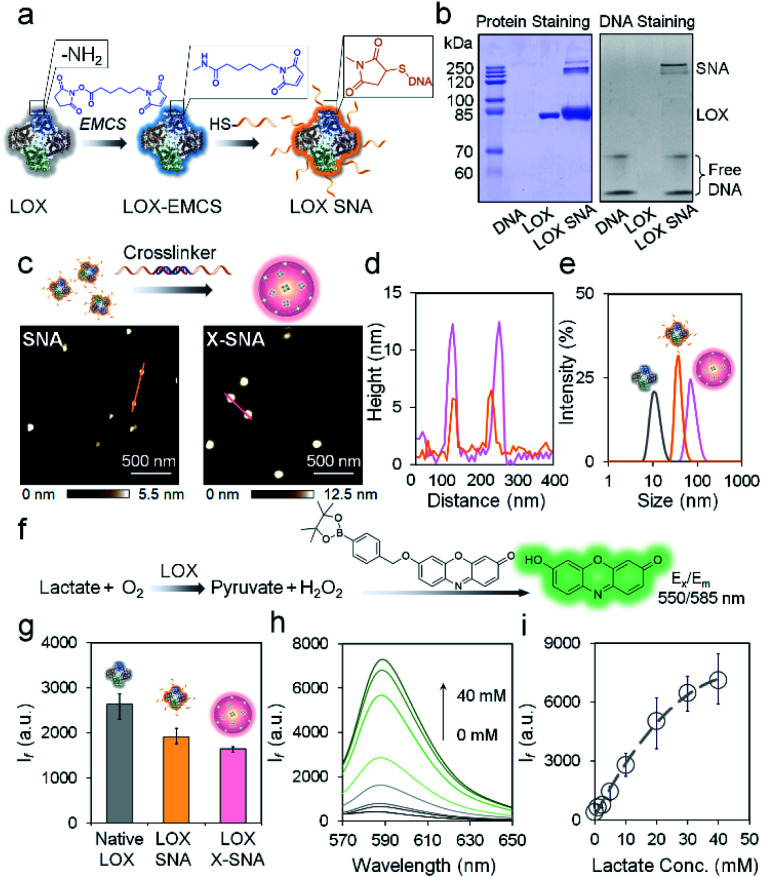
Fig. 2. (a) Schematic illustration of the functionalization of LOX with DNA. (b) Protein-staining image (left) and fluorescence (right) image of a native PAGE gel showing the LOX SNA. (c) AFM height images of as-synthesized LOX SNA (left) and X-SNA constructs (right). (d) Corresponding cross-sectional analysis of SNA (orange) and X-SNA (pink). (e) DLS characterization of native LOX (gray), SNA (orange), and X-SNA (pink). (f) Signal transduction process of the lactate detection using LOX. The generated H2O2 turned on the fluorescence of indicator. (g) Histogram of fluorescence intensity showing the catalytic activity of native LOX, SNA, and X-SNA based on the reaction depicted in (f). (h) Fluorescence spectra of X-SNA probe responding to lactate concentrations from 0–40 mM. (i) Calibration profile of X-SNA probe showing the increase of lactate concentration resulted in the increase of fluorescence intensity. Error bars indicate standard deviations of three independent measurements.

Fig. 2