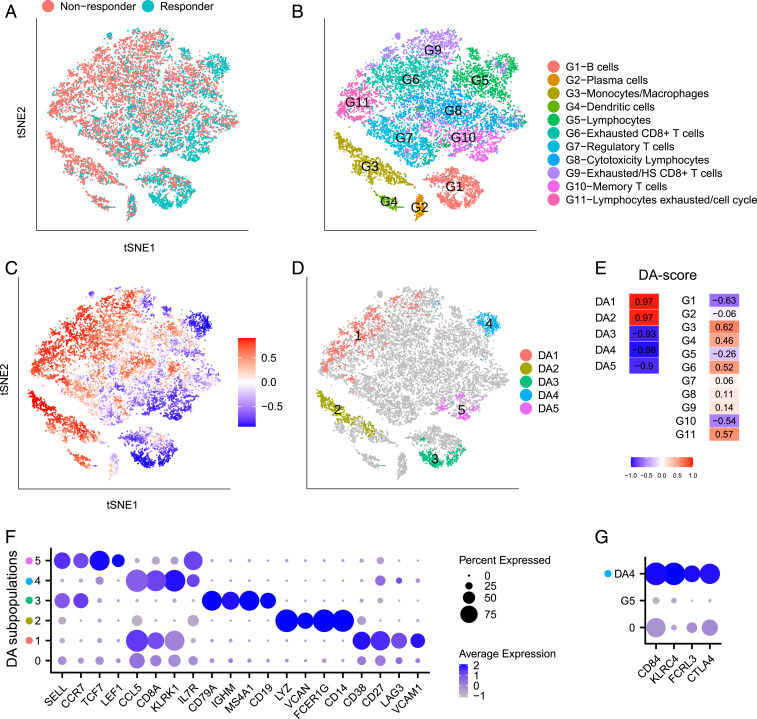
Fig. 2.
Immune cells from responding and nonresponding melanoma patients treated with checkpoint therapy. (A–D) t-SNE embedding of 16,291 cells from ref. 7. (A) Cells colored by status of response to immune therapy. (B) Cells colored by cluster labels from ref. 7. (C) Cells colored by DA measure. Large (small) values indicate a high abundance of cells from the pool of nonresponder (responder) samples. (D) Five distinct DA subpopulations obtained by clustering cells with DA measure> 0.8. (E) DA score of DA subpopulations and predefined clusters. (F) Dot plot for markers characterizing the five selected DA subpopulations. The color intensity of each dot corresponds to the average gene expression across all cells in the DA subpopulation excluding the cells with zero expression values. The lowest row in the plot corresponds to the non-DA cells (cells not included in any DA subpopulations). (G) Dot plot for markers that distinguish and the complementary cells within .

