Fig. 5.
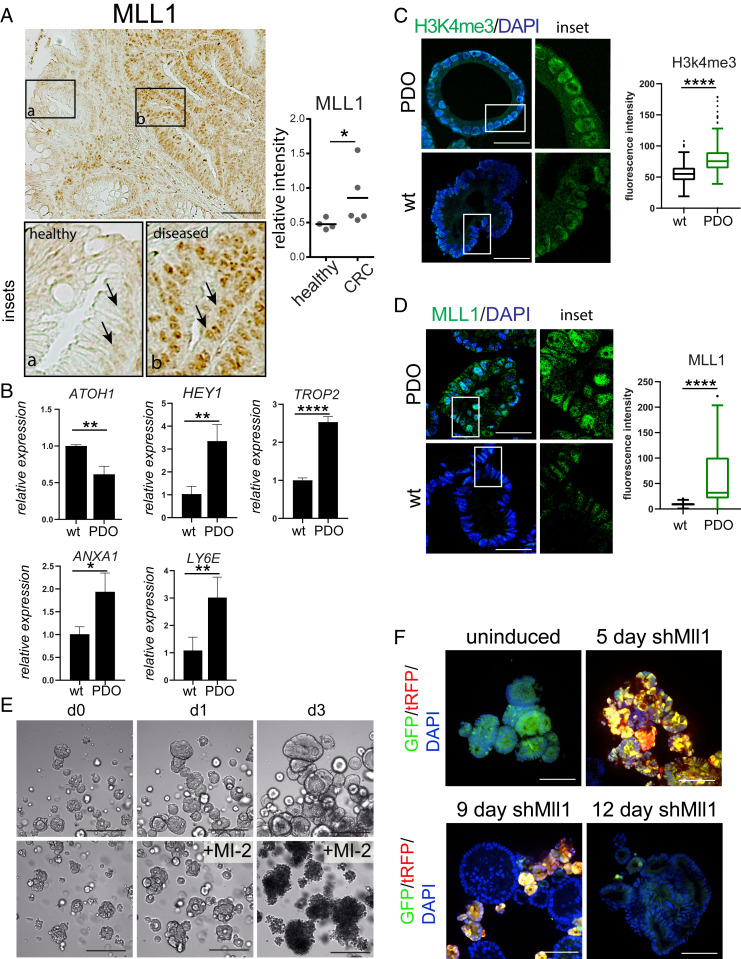
MLL1 in human colorectal cancer. (A) Immunohistochemistry for MLL1 on CRC patient tissue sections (Scale bar, 100 µm.); comparing healthy (Inset a) and tumor (Inset b) epithelia. Quantification of MLL1 expression in healthy and CRC patient tissues on the Right (n = 5). (B) Relative mRNA expression of Notch and regenerative marker genes. (C) Immunofluorescence for H3K4me3 (green) of patient-derived and WT human organoids (Scale bar, 50 µm); quantification is on the Right. (D) Immunofluorescence for MLL1 (green) of patient-derived and WT human organoids (Scale bar, 50 µm); quantification is on the Right. (C and D) Comparison of two individual organoid lines of each condition and a total of 8 to 10 organoids measured. (E) Brightfield images of untreated (Upper) and 2.5 µM MI-2 treated patient-derived CRC organoids over the indicated time points. (Scale bar, 250 µm.) (F) Lentiviral shRNA knockdown of MLL1 in patient-derived organoids 5 d and 12 d after induction with doxycycline. Infected cells capable of shRNA production express GFP (green) and shRNA-producing cells express turboRFP (red) after doxycycline-induction. (Scale bar, 80 µm.) (*P ≤ 0.05, **P ≤ 0.001, ***P ≤ 0.0001.)

