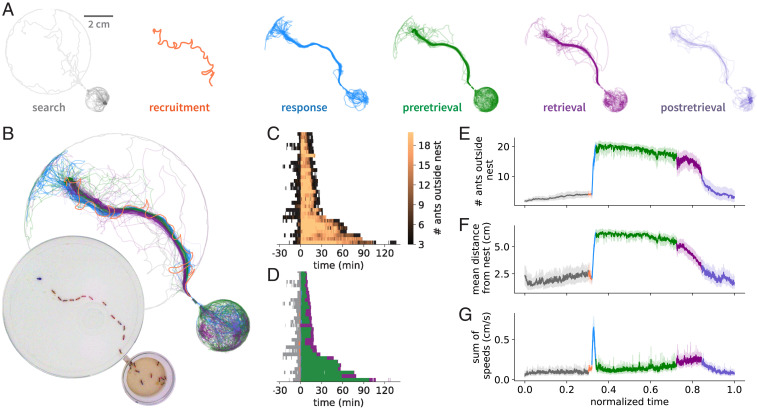
Fig. 1.
The anatomy of a group raid. (A) Trajectories of ants at each phase of a representative group raid (Movies S1 and S2), separated into six sequential phases (see Methods). The orange track in the recruitment phase depicts the path taken by the recruiting ant, whereas tracks in all other phases depict the paths of all ants in the colony. (B) Overlay of trajectories from all six phases. (Inset) Snapshot of the colony at the peak of the response phase. A short tunnel separates the nest (small circle) from the foraging arena (large circle), and the food (blue spot) is at the top left. (C) Heat map showing the number of ants outside the nest over time. Thirty-one raids are sorted vertically by their duration and are aligned to the start of recruitment. (D) Representing each phase of each raid by the same color code as in B shows that variation in raid length is primarily determined by the length of the preretrieval phase (SI Appendix, Fig. S2). We do not show the postretrieval phase here, because it has constant length by definition (see Methods). (E–G) Aligning and rescaling each phase of each raid (see Methods) and plotting the time course of the mean number of ants outside the nest (E), their mean distance from the nest (F), and the sum of the speeds of all ants (a measure of collective activity) (G) shows that the temporal structure of group raids is highly stereotyped. The error bands in E–G represent the 95% CI of the mean.

