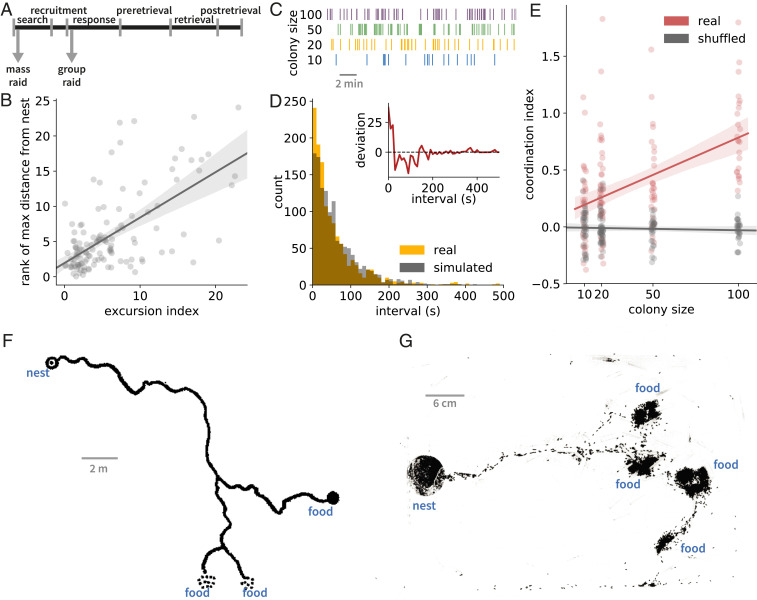
Fig. 4.
Group raids turn into mass raids with increasing colony size. (A) The onset of a mass raid is homologous to the search phase of a group raid, despite the superficial resemblance to its response phase. Arrows indicate when a column of ants leaves the nest in each type of raid. (B) On average, early excursions (low excursion index) terminate closer to the nest than later excursions (high excursion index) (n = 127 excursions, colony size 25, linear regression r = 0.65, P = 2 × 10⁻¹⁶). (C) Four example sequences of nest exit times, sorted by colony size. (D) An example distribution of interexit intervals in a colony of size 20. This distribution (in amber) deviates significantly from a simulated exponential distribution (in gray) (Anderson–Darling k-sample test P = 0.001). (Inset) Difference between this distribution and 1,000 simulated exponential distributions, as a function of the interval, showing an increased coefficient of variation (red line is mean difference, with 95% CI). Nest exits in close succession (i.e., short intervals) are overrepresented in the empirical distribution compared to simulated distributions. (E) The coordination index (see Methods) of real interexit intervals (red data points) increases as a function of colony size (n = 131 exit sequences, linear regression r = 0.48, P = 4.9 × 10⁻⁹), but the coordination index of shuffled interval sequences (gray data points) does not (n = 131 exit sequences, linear regression r = 0.79, P = 0.89). (F) Schematic of a mass raid of the army ant Aenictus laeviceps, reformatted with modifications from ref. 42. (G) Snapshot (background-subtracted and contrast-enhanced; see Methods) of an O. biroi raid in a colony with ca. 5,000 workers. The raid shows all the major features of the army ant mass raid depicted in F. Error bands in B and E depict the 95% CI of the regression line.

