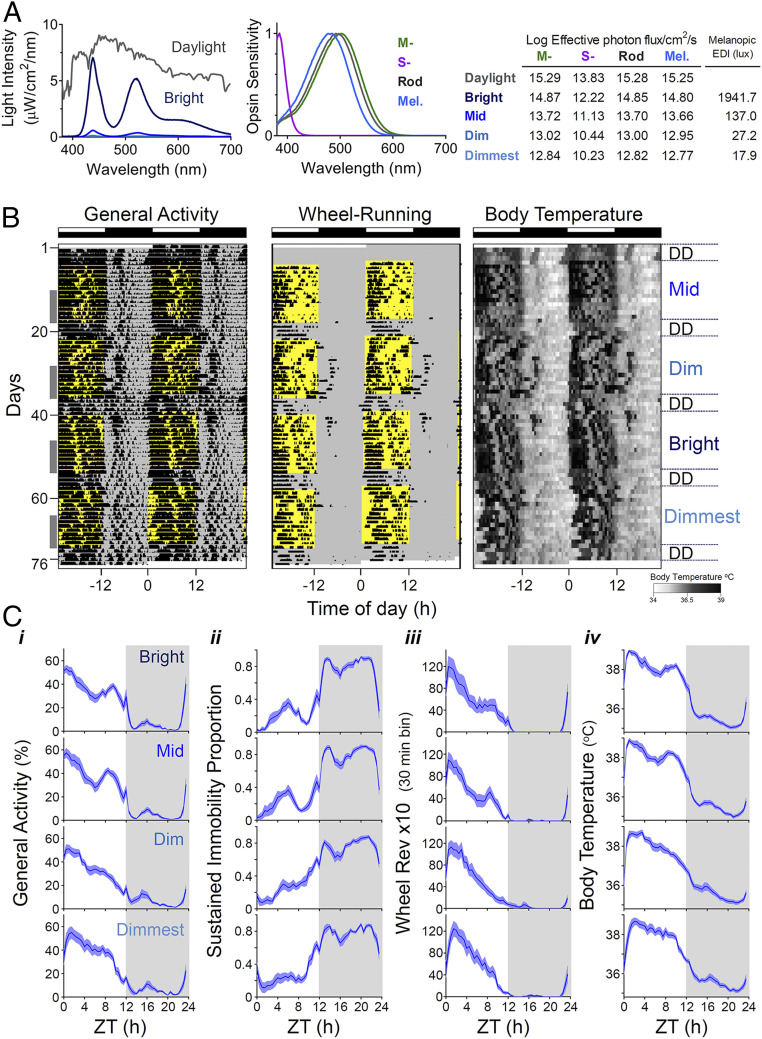
Fig. 1.
Impact of increasing daytime light intensity on circadian rhythms in R. pumilio. (A) Lighting conditions. Left shows the spectral power distribution of our light source at different irradiances and that of daylight on an overcast day. Middle shows expected spectral sensitivity profile of mammalian rod opsin and melanopsin and R. pumilio medium and short wavelength-sensitive cone opsins (MWS and SWS, respectively) (61) corrected for lens transmission. Right table shows Log10 effective photon fluxes for each opsin and melanopic EDI across the different lighting stimuli used (bright, mid, dim, dimmest). (B) Double-plotted actograms for general activity, wheel running and Tb (scale below) from a representative R. pumilio under different lighting conditions, over a period of 2.5 mo. Time of light exposure is indicated in yellow, and intensity of the light is shown on the Right. Entrainment to 12:12 LD cycle at each irradiance ran for 2 wk followed by 4 d in constant darkness (DD). Note that across conditions, activity is largely restricted to daytime (light phase) coinciding with higher Tb values. However, the rhythms become less robust at low light levels. Gray columns on the left indicate the 8-d period at the end of each stage used for analysis reported in SI Appendix, Table S1 and Fig. 2. (C) Mean waveforms for the recorded biological rhythms (i: general activity; ii: sustained immobility; iii: voluntary wheel-running activity; iv: Tb) across the different lighting conditions. Mean waveforms under bright intensities are shown in the Top and the dimmest conditions in panels at the Bottom. Values are expressed as mean ± SEM (n = 12), gray areas indicate period of darkness. ZT0: ZT 0 corresponds to time of lights on.

