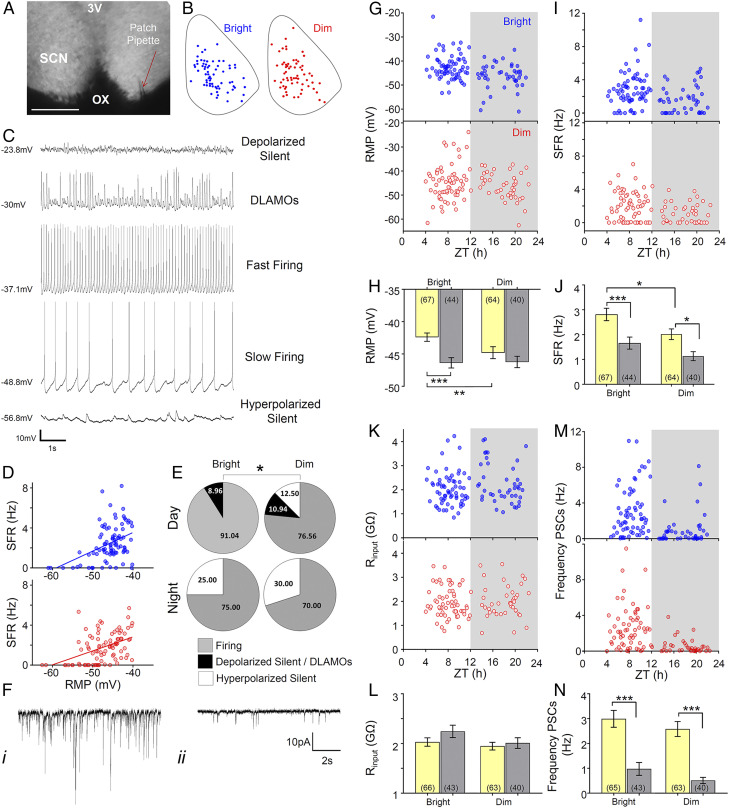
Fig. 4.
Increasing daytime light intensity impacts SCN neurophysiology at the single-cell level. (A) Whole-cell recording setup showing bright-field image (4×) of a living SCN in coronal brain slice either side of the third ventricle (3V) and above the optic chiasm (OX), with a patch pipette (red arrow) targeting an SCN neuron. (Scale bar, 200 μm.) (B) Schematic diagram showing the approximate location within a representative SCN coronal slice of the recorded cells giving rise to the daytime datasets under bright (blue) or dim (red) daytime irradiance. Note the similar spatial distribution between experimental groups. (C) Representative traces for each of the spontaneous membrane excitability states encountered in R. pumilio SCN neurons (from Top): highly depolarized silent; depolarized displaying low-amplitude membrane oscillations (DLAMOs); moderate RMP and firing at high or low rate; and hyperpolarized silent. (D) Positive correlation between RMP and SFR for cells recorded from bright (blue) and dim (red) conditions. Cells resting at RMP > −40 mV were excluded. P < 0.0001, linear regression analysis. (E) Pie charts showing the percentages of cells in the different electrophysiological states during the day and at night from bright and dim conditions. (*P = 0.01, chi-squared test.) (F) Example of traces from two SCN neurons (voltage clamped at −70 mV) showing PSCs recorded during the day (i) and at night (ii). (i) Cell displaying high frequency and amplitude PSCs; (ii) cell showing low frequency and amplitude PSCs. (G) Scatter plot showing the RMP of the different cells across ZTs for bright (blue) and dim (red) conditions. Each dot represents an individual cell. Gray background indicates the projected phase of lights off. (H) Mean RMP during the day and at night for SCN neurons from bright or dim conditions. (I and J) Same as in G and H but for SFR. (K and L) Same as in G and H but for Rinput. (M and N) Same as in G and H but for synaptic activity frequency. Data in bar charts are expressed as mean ± SEM. Number of cells used is indicated between brackets in each bar. *P < 0.05, **P ≤ 0.01, and ***P ≤ 0.001, Mann–Whitney U test.

