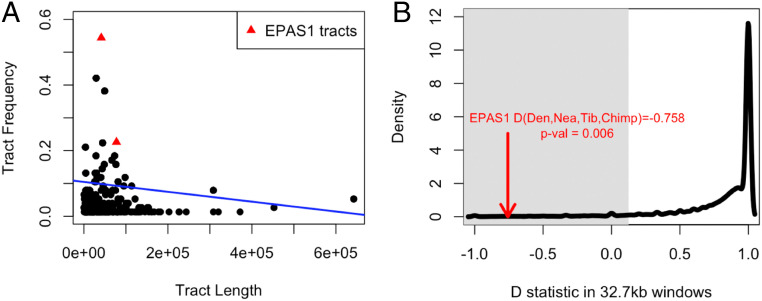
Fig. 2.
Introgressed tract length and frequency and D statistics. A shows the lengths (x axis) and frequencies (y axis) of introgressed tracts inferred by an HMM applied to the high Denisovan affinity regions detected with SPrime in 38 Tibetans. These regions have a match rate <40% to Neanderthals and >60% to Denisovans (Fig. 1 and Methods). The red triangles represent the introgressed tracts at EPAS1, including a long and a short segment (80 and 40 kb, respectively). The tract frequency is the number of haplotypes harboring the tract of a specific length divided by the total number of haplotypes. B shows the distribution of divergence between two Neanderthals captured by the ABBA-BABA (D) statistic in the form of (Denisovan, Altai Neanderthal, Vindija Neanderthal, Chimp) in nonoverlapping 32.7-kb windows (black solid curve). The shaded gray area is defined by the lower 5% percentile of the distribution (to the Left of D = 0.125). The red arrow points to the value of D(Denisovan, Neanderthal, Tibetan, Chimp) at the 32.7-kb window within EPAS1 identified in Huerta-Sánchez et al. (23). The value of D(Denisovan, Neanderthal, Tibetan, Chimp) in the adaptive 32.7-kb region in EPAS1 is statistically significant (P = 0.006).

