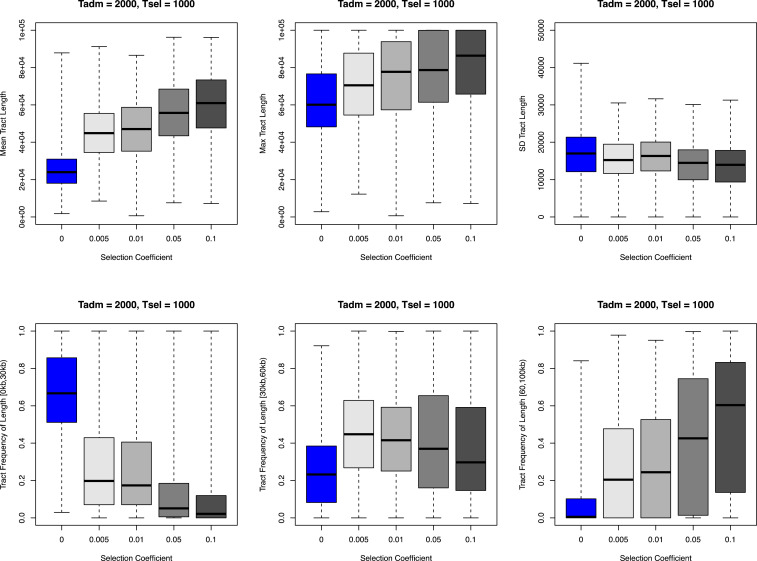
Fig. 3.
Relationship between introgressed tract length and selection coefficient, admixture time, and selection start time. We show the relationship between introgressed tract length (summarized by six statistics) and selection coefficient with simulations. In the simulations shown here, the admixture time (Tadm) is fixed at 2,000 generations ago, and the selection time (Tsel) starts at 1,000 generations ago (standing archaic variation). The introgressed tract lengths are tracked directly from the simulation program SLiM. Each data point in the box plot represents the statistic in all individuals from the admixed population per simulation. Each combination of evolutionary parameters (selection time, selection coefficient) was repeated 5,000 times in simulations. The demography for the simulations is model D in SI Appendix, Fig. S7.

