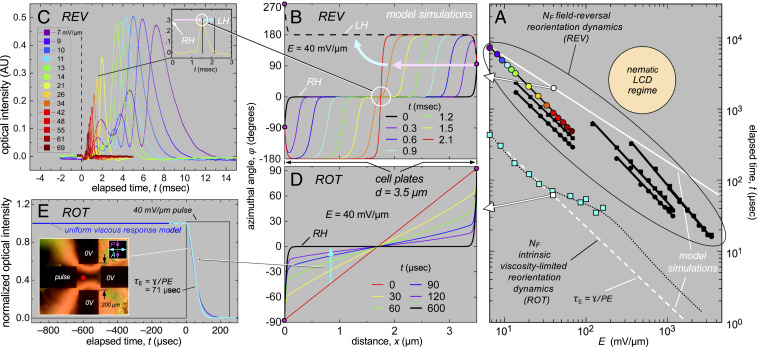
Fig. 3.
Electro-optics and dynamics of RM734 in the NF phase at T = 110 °C. (A) Experimental and model field-induced polarization reversal (REV) and viscosity-limited (ROT) reorientation times. REV regime: black points are field reversal data from ref. 14; colored filled circles are peak positions from C; white circle and solid white line give soliton arrival times at the cell center in B. ROT regime: cyan squares are reorientation times from curve fits of 𝜑 E(t) obtained by fitting the transmission data in E; white square and dashed white line correspond to reorientation of the type shown in D; dotted black curve is the leaky capacitive interface model (Eq. 1). REV times are longer because field reversal generates some degree of solitonic response as in B, in which parts of the cell wait for a soliton to pass in order to reorient. (B) Simulated response of the polarization to an electric field reversal (REV). The cell is initially in a distorted RH πT state (black curve). When the field is flipped, P in most of the cell finds itself in a state of low-torque, unstable equilibrium (𝜑 ∼ 0), where it remains until solitons, which form at the surfaces, pass by. The final state (red curve) has a 2π-twist wall at the cell center, which disappears by order reconstruction (cyan arrow), leaving the LH πT state (dashed black curve). Arrival of the solitons at the cell center (white circle) produces local director reorientation that gives the optical transmission peaks in C. (C) Optical response between crossed polarizer and analyzer following field reversal. Peak transmission times are plotted in A using the same color coding. A similar optical response is observed for the either sign of field reversal, showing that each reversal completely switches the handedness of the πT state. (D) Simulated ROT response of a uniformly twisted RH πT state to an applied E field favoring its midcell orientation at 𝜑 = 0. In the final field-induced state (black), the field penetration length of the surface orientation into the cell, 𝜉E = √(K/PE), is small. In this limit, each element dx = 𝜉E of the director profile 𝜑(x) responds independently to the field, as 𝜑E(t), so that this graphic effectively also shows the time course of 𝜑(t) in ROT reversal for different starting 𝜑o (see text), and can be used to analyze the uniform 𝜑(t) field rotation experiment in E. (E) Four gold-electrode cell (NSEW) with random-planar alignment. A small DC bias sets the starting orientation 𝜑o to ∼45°. A pulsed voltage (40 mV/μm for 250 μs) is then applied to W, with NS and E grounded, and the transmission I(t) between crossed P and A is measured. The 10–90% response times are shown vs. field amplitude as the cyan squares in A. In weak applied fields, the response times decrease as 1/E and are used to determine ɣ. The deviation from 1/E dependence at intermediate E is an effect of depolarization voltage at the electrodes, modeled as a leaky capacitor (black dots; see text).

