. 2020 Nov 23;12(4):1469–1478. doi: 10.1039/d0sc05078d

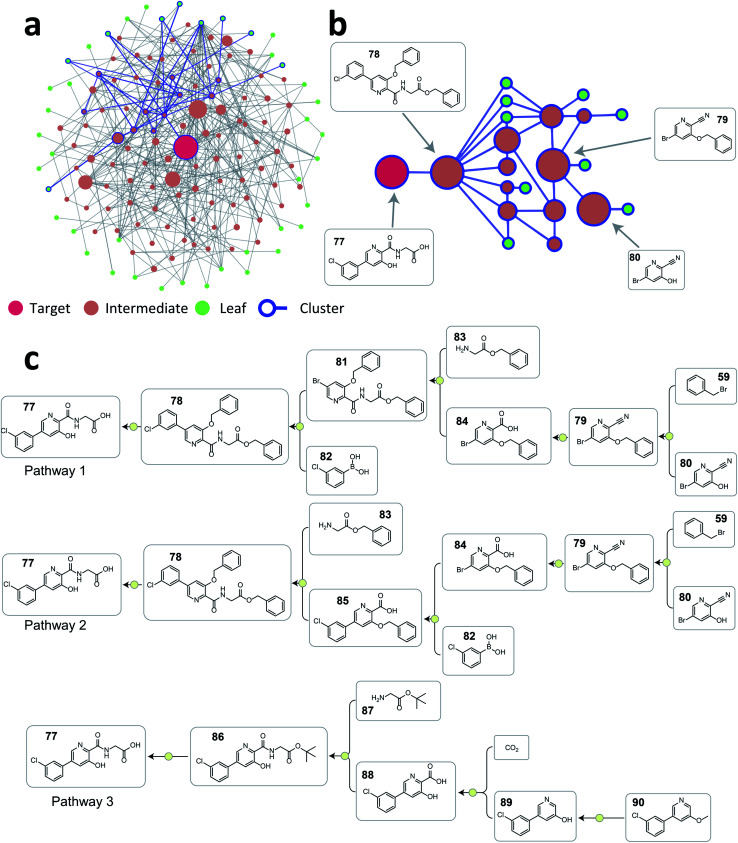
Fig. 6. (a) The reaction network graph of 2000 retrosynthesis pathways of vadadustat 77 generated from ASKCOS. Each circle node represents a unique compound, and the node size is linearly correlated with its appearance counts among the 2000 pathways. Compounds and connections from one example cluster are highlighted with blue color. (b) The reaction network subgraph of the highlighted example cluster. The node size is linearly correlated with its appearance counts among this cluster. (c) Three representative pathways chosen from the 2000 pathways. Pathway 1 and 2 are from the example cluster shown in Fig. 6b, and pathway 3 is from a different cluster.

Fig. 6