Fig. 1.
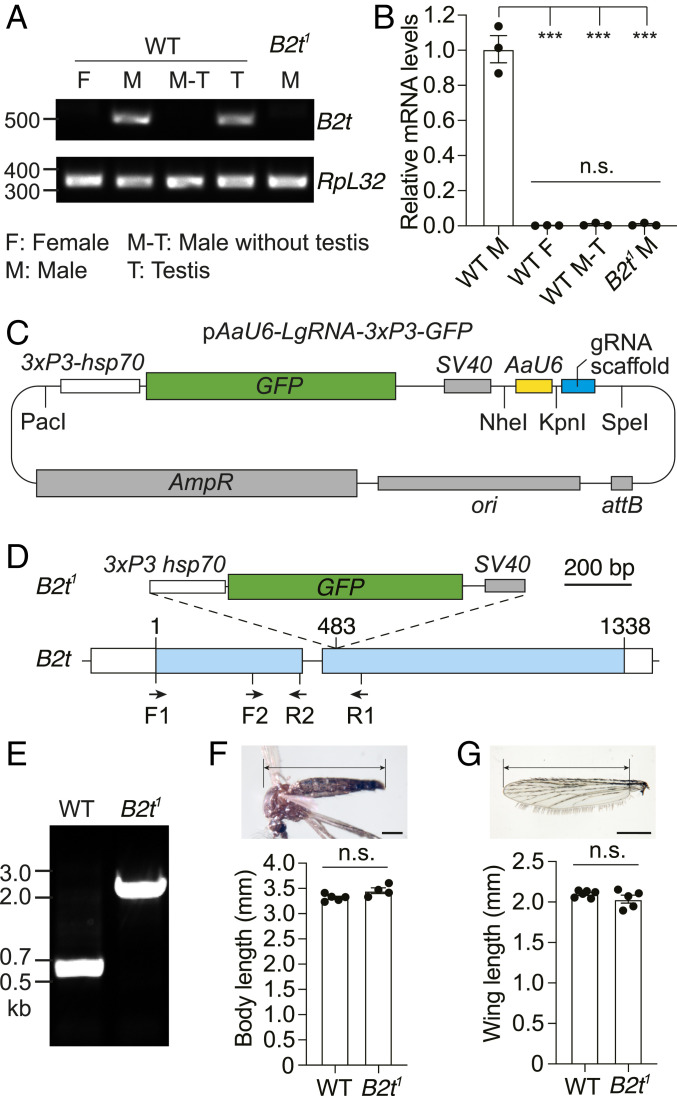
Generation of the B2t1 knock-in mutant and examination of testis-specific expression of B2t. (A) RT-PCR showing B2t mRNA expression in the indicated samples and sexes from wild type (WT) and B2t1. The locations of the primers used (F1 and R1) are illustrated in D. RpL32 is used as an internal control. The expected PCR products are 527 bp for B2t and 345 bp for RpL32. F, female; M, male; M-T, male without testis; T, testis. (B) Real-time RT-PCR showing relative B2t transcript levels in the indicated samples. The primer pair used (F2 and R2) is presented in D. Three biological replicates, each with three technical replicates, were used for each sample. Means ± SEMs. Statistics were performed using one-way ANOVA with the Tukey’s multiple comparisons test. n.s., not significant; ***P < 0.001. (C) Schematic of the pAaU6-LgRNA-3xP3-GFP plasmid used for engineering the knock-in constructs for CRISPR/Cas9-mediated genome editing of B2t. The PacI and NheI restriction sites were used to introduce the 5′ and 3′ homologous arms in B2t, respectively. The KpnI and SpeI restriction sites were used to clone the gRNA. The vector contains the following components: 3xP3-hsp70, three P3 binding elements and a minimal promoter from the Drosophila hsp70 gene; GFP, coding sequence for green fluorescent protein; SV40, SV40 transcriptional terminator; AaU6, Ae. aegypti U6 promoter; gRNA scaffold; attB sequence; ori, origin of replication; and ampR, ampicillin-resistant gene. (D) Schematic showing the 3xP3-GFP-SV40 knocked into the B2t gene to create the B2t1 allele. The location of the primers used in A, B, and E (F1, F2, R1, and R2) are indicated. (Scale bar, 200 bp.) (E) PCR genotyping of the B2t1 allele. The locations of the primers used are F1 and R1 and are presented in D. The expected PCR products are 584 bp in WT and 1.9 kb in B2t1. (F) Body sizes of WT and B2t1 mutant males. The image illustrates the area used for the length measurements. n = 4 to 5 groups. Each group included ≥5 mosquitoes. The total number of mosquitoes measured was 60 for WT and 32 for B2t1. Means ± SEMs are indicated. Statistics were performed using Mann–Whitney U test. n.s., not significant. (Scale bar, 500 μm.) (G) Wing lengths of WT and B2t1 mutant males. The image illustrates the area used for the length measurements. n = 5 groups. Each group included ≥10 wings. The total number of wings measured was 71 for WT and 101 for B2t1. Means ± SEMs are indicated. Statistics were performed using Mann–Whitney U test. n.s., not significant. (Scale bar, 500 μm.)

