. 2020 Nov 19;12(4):1352–1362. doi: 10.1039/d0sc05431c

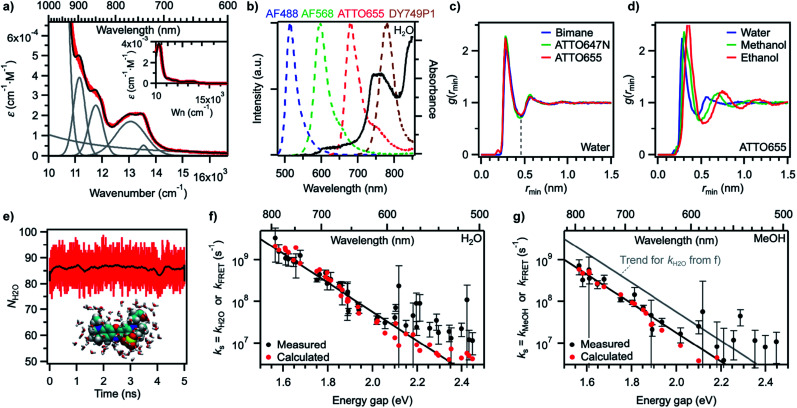
Fig. 5. (a) Measured absorption spectrum of H2O on the wavenumber scale (red) and reconstructed H2O spectrum (black) after decomposition into individual components (grey). Inset: same spectra on a larger ε scale (Wn: wavenumber). (b) Overlap between intensity-normalized emission spectra of various fluorophores (dashed lines, left axis) and the absorption spectrum of H2O (black line, right axis). (c) Minimum-distance distribution functions for fluorophores of different sizes in water. The dashed line at the first minimum indicates the size of the first solvent shell. (d) Minimum-distance distribution functions for the fluorophore ATTO655 in different solvents. (e) Number of water molecules within the first solvent shell of ATTO655 as a function of simulation time (1 ps time interval). The black trace was obtained by smoothing red data points (250 ps) and highlights that the number is fairly constant. A snapshot of the molecular structure of ATTO655 and the water molecules in the first solvent shell is given as an inset. (f) Measured water quenching rate constant kH2O (black circles) and trend line as in Fig. 4a, and calculated dipole–dipole energy transfer rate constant kFRET (red circles) in water. (g) Measured methanol quenching rate constant kMeOH (black circles) and trend lines as in Fig. 4b, and calculated dipole–dipole energy transfer rate constant kFRET (red circles) in methanol.

Fig. 5