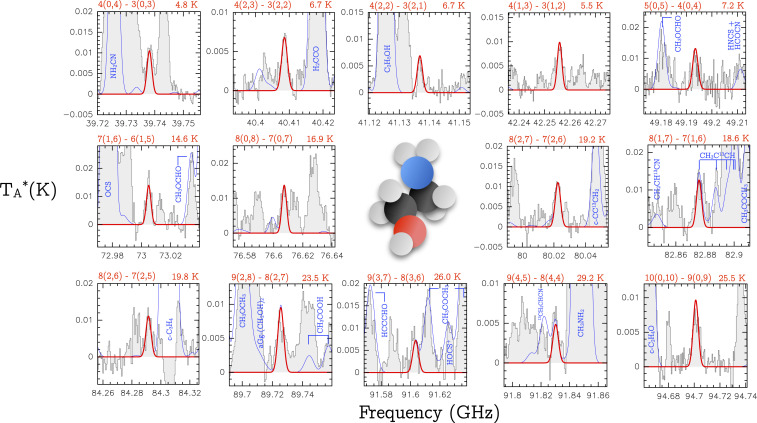
Fig. 2.
Unblended or slightly blended transitions of EtA toward the G+0.693–0.027 molecular cloud. The quantum numbers involved in the transition are indicated in the upper left of each panel, and the energies of the upper level are indicated in the upper right. The red thick line depicts the best LTE fit to the EtA rotational transitions. The thin blue line shows the expected molecular emission from all of the molecular species identified in our spectral survey, overplotted to the observed spectra (gray histograms). The three-dimensional structure of EtA is shown in the center of the figure; black, red, blue, and white balls denote carbon, oxygen, nitrogen, and hydrogen atoms, respectively.

