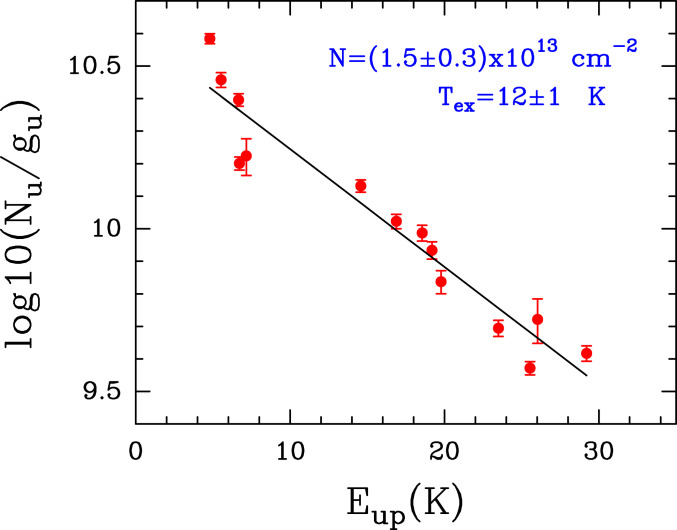
Fig. 4.
Rotational diagram of EtA. The analysis procedure is described in Materials and Methods. The red dots correspond to the 14 EtA transitions shown in Fig. 2 and Table 1. The black line is the best linear fit to the data points. The derived values for the molecular column density () and the , along with their uncertainties, are indicated in blue in the upper right corner.

