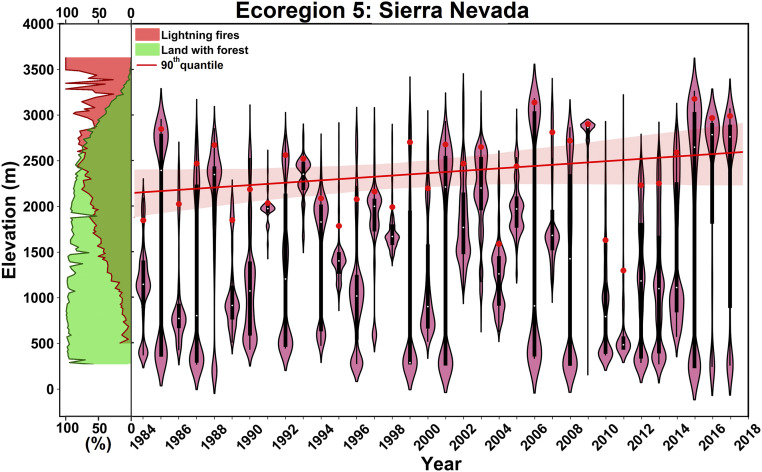
Fig. 2.
Normalized annual elevational distribution of burned forest for Sierra Nevada. Percent forest cover across the elevational band is shown with green shaded area, percent lightning-started fires are shown with red shaded area on the Left, and Z90 for each year is marked with red dots. The red line indicates the slope of Z90 during 1984 to 2017, with uncertainty range shown with shaded area.

