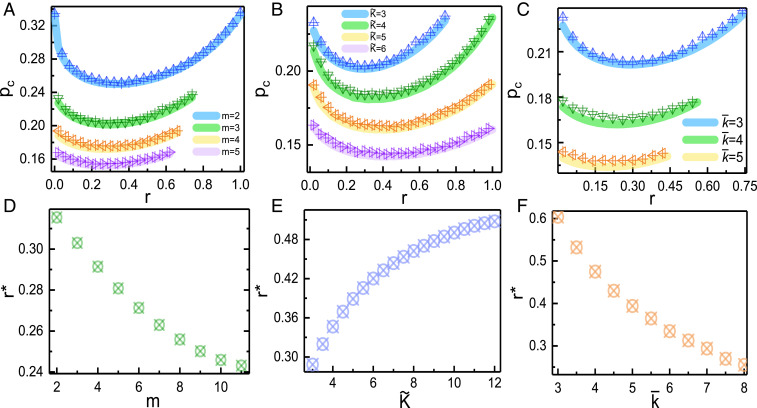
Fig. 2.
(A–C) Analytical predictions (thick lines) compared with simulation results (symbols) for as a function of for different , , and for a star coupling pattern. Analytical results are from Eq. 5 and SI Appendix, Eq. 12. The parameters are = = 3 in A, and in B, and and in C, respectively. D–F show the results of as functions of , , and . The parameters are the same as for A–C. Simulation results are averaged over 1,000 independent realizations with for each subnetwork .

