. 2020 Dec 28;12(7):2623–2628. doi: 10.1039/d0sc03903a

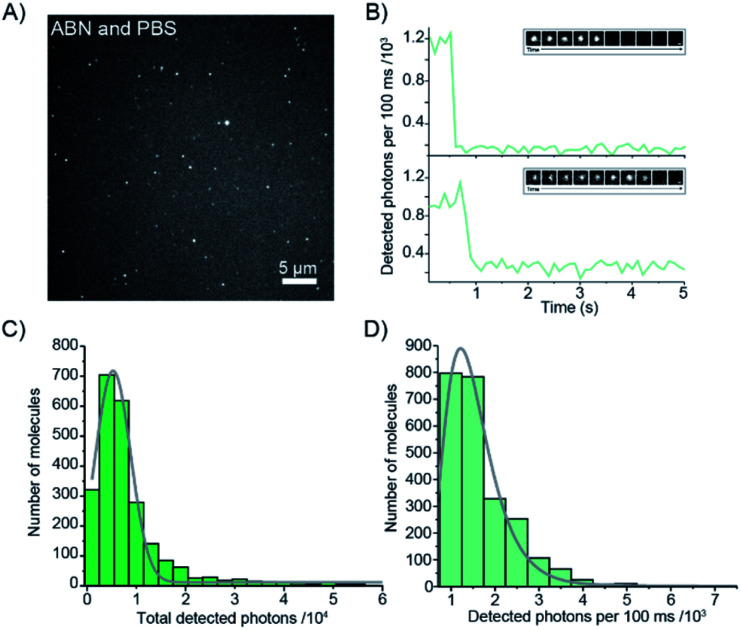
Fig. 6. 1P single-molecule characterization of ABN. (A) Average fluorescence intensity projection of a 15 s movie of single ABN molecules adsorbed onto a glass surface. (B) Fluorescence intensity as a function of time of two single ABN molecules, with subselections of the traces shown as time montages (inset, scale bar = 200 nm). (C) A histogram showing the distribution of the total number of photons detected from single ABN emitters, μ = 5300 ± 1800 photons determined from a log-normal distribution fit. (D) A histogram showing the mean number of photons detected/frame for single ABN emitters, μ = 1500 ± 600 photons/100 ms, determined from a log-normal distribution fit. (N = 2402 molecules).

Fig. 6

HHS Vulnerability Disclosure