. 2020 Dec 22;12(6):2198–2208. doi: 10.1039/d0sc04823b

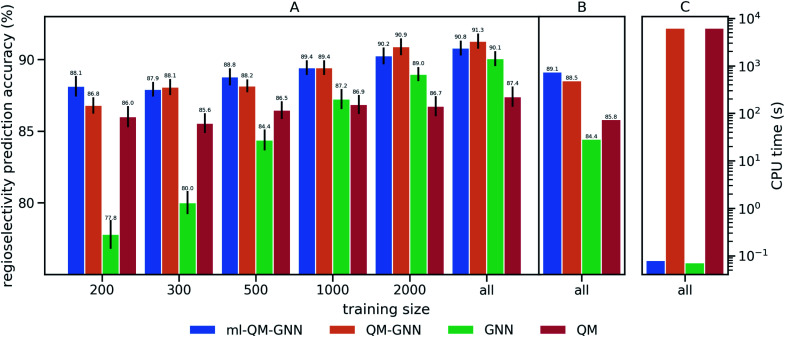
Fig. 3. Performance comparison of the QM, GNN, QM-GNN, and ml-QM-GNN models on predicting the regioselectivity of selected EAS reactions. Prediction accuracy indicates the success rate of correctly predicting major products for the testing set. (A) 10-Fold cross-validation based on random splitting of the dataset, where the training set is optionally downsampled to contain only 200, 300, 500, 1000, or 2000 examples for each iteration, while the size of testing set is fixed to 303 for each iteration across different training size. The error bar shows the standard error of the mean of top-1 regioselectivity prediction accuracy on the testing set for each of the 10 cross-validation folds. (B) Performance based on scaffold splitting. (C) Average computation time for predicting the regioselectivity for a given reaction on a single CPU (full training size: N = 2397).

Fig. 3