. 2021 Jan 4;12(8):2823–2828. doi: 10.1039/d0sc05408a

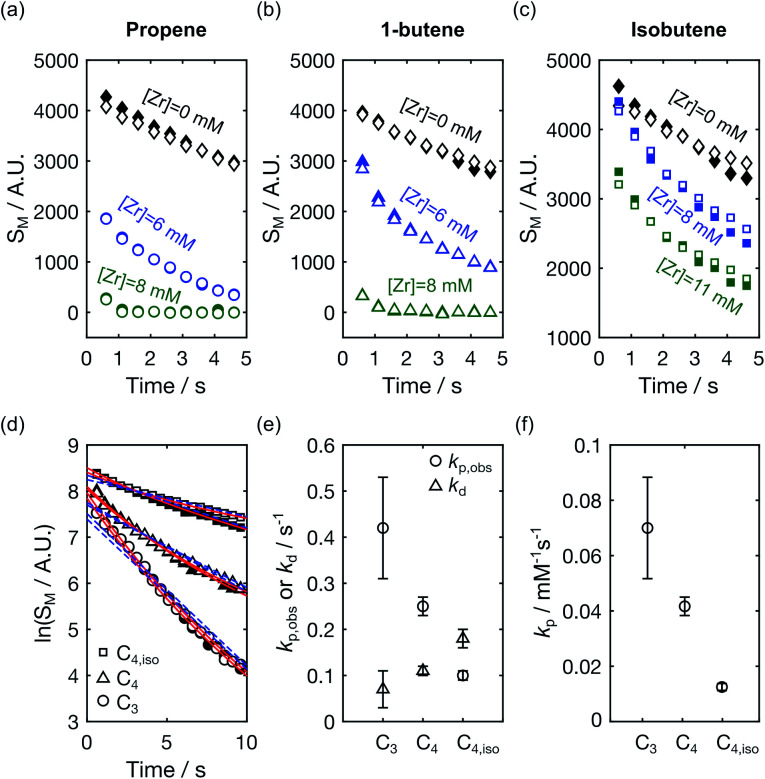
Fig. 4. Signal intensities of hyperpolarized (a) propene (b) 1-butene and (c) isobutene in the absence ([Zr] = 0 mM) and presence ([Zr] > 0 mM) of a polymerization reaction. Data points with empty and filled symbols represent the C1 and C2 signals, respectively. (d) Signal integrals of C1 and C2 obtained from when [Zr] = 6 mM from the panels (a) and (b), and [Zr] = 8 mM from panel (c) plotted on a logarithmic scale. Data points for propene (C3), 1-butene (C4), and isobutene (C4,iso) are denoted by the symbols ‘○’, ‘Δ’, and ‘□’, respectively. The red solid lines were fitted using eqn (4) in ref. 9, and the blue fitted broken lines were obtained using an exponential time dependence. (e) The fitted values of kp,obs and kd from the red fitted line in (d) are shown with the symbols ‘○’ and ‘Δ’, respectively, and the error bars represent the 95% confidence intervals of the fit parameters. (f) Polymerization rate constants normalized with the [Zr] concentration.

Fig. 4