. 2021 Jan 5;12(8):2970–2978. doi: 10.1039/d0sc05650b

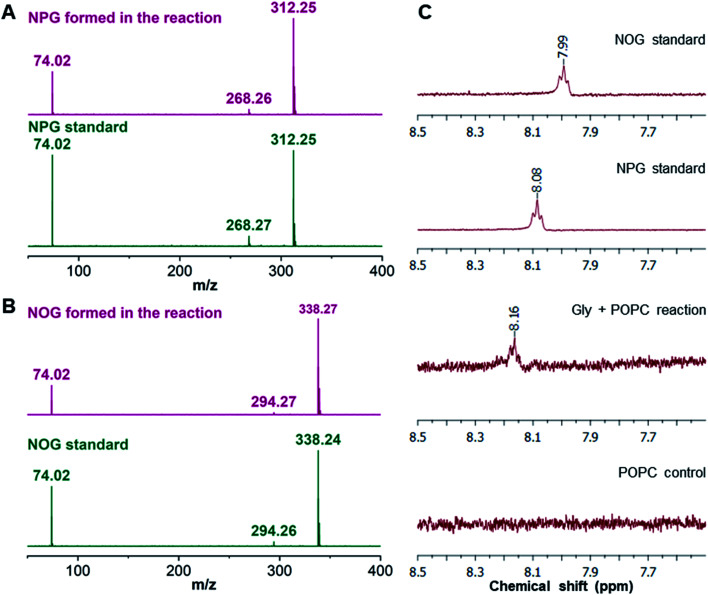
Fig. 3. Confirmation of NAA formation in the Gly + POPC reaction by HRMS/MS and NMR analysis. HRMS/MS analysis of (A) NPG and (B) NOG, formed in the Gly + POPC reaction, whose fragmentation pattern overlaps with those produced by commercially purchased NPG and NOG standards, respectively. The analysis was performed in the negative ion mode. (C) The 1H NMR analysis of the butanol phase collected during the BH extraction of Gly + POPC reaction (3rd trace from the top) shows a signature peak corresponding to the hydrogen atom involved in the amide linkage at around 8 ppm. This peak is also present in 1H NMR spectra of NPG and NOG standards (top two traces). However, this peak is not observed in the 1H NMR spectrum of the POPC control reaction (last trace). The full NMR spectra are provided in the ESI..

Fig. 3