. 2020 Nov 12;12(10):3448–3459. doi: 10.1039/d0sc04789a

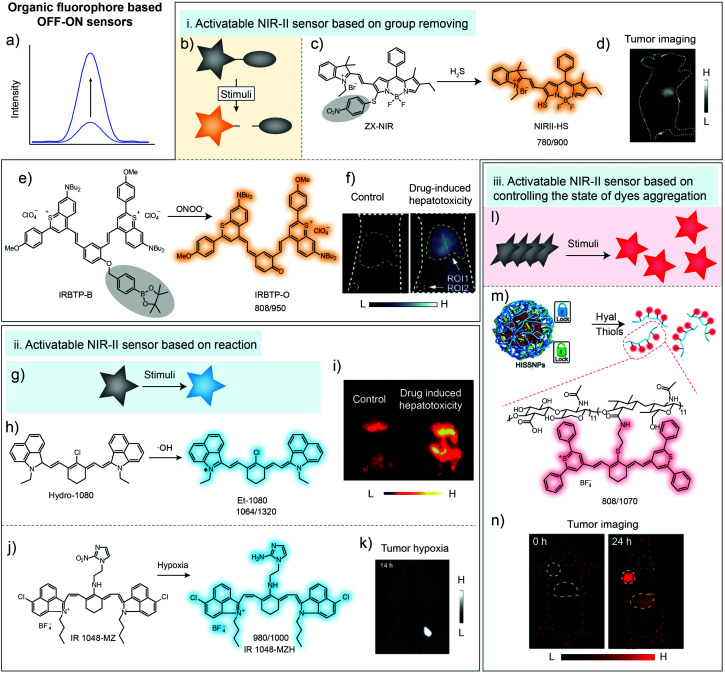
Fig. 3. Organic fluorophore for biosensing in the NIR-II window. (a) Illustration of fluorescence spectral variation during organic fluorophore-based sensing. (b) Illustration of the NIR-II sensor based on group removing. (c) Chemical structure of the H2S-activatable NIR-II fluorescence sensor ZX-NIR and the sensing mechanism. (d) NIR-II imaging of human colorectal cancer with ZX-NIR administration. Reproduced from ref. 39 with permission from Wiley-VCH, Copyright 2018. (e) Chemical structure of the ONOO-activatable NIR-II fluorescence sensor IRBTP-B and the sensing mechanism. (f) Images of mouse liver during PBS- or APAP-induced hepatotoxicity with IRBTP-B administration. Reproduced from ref. 40 with permission from American Chemical Society, Copyright 2019. Removed groups are indicated with gray circles. (g) Illustration of the NIR-II sensor based on reaction. (h) The chemical structure of the ·OH-activatable NIR-II fluorescence sensor Hydro-1080 and the sensing mechanism. (i) NIR-II imaging of drug-induced hepatotoxicity of mice with Hydro-1080 administration under 1064 nm excitation. Reproduced from ref. 36 with permission from American Chemical Society, Copyright 2019. (j) Chemical structure of the hypoxia-activatable NIR-II fluorescence sensor IR1048-MZ and the sensing mechanism. (k) NIR-II imaging of tumor hypoxia with IR1048-MZ administration. Reproduced from ref. 37 with permission from the Ivyspring International Publisher, Copyright 2018. (l) Illustration of the NIR-II sensor based on controlling the dye aggregation states. (m) Schematic of tumor-specific imaging nanoparticles (HISSNPs). (n) NIR-II imaging of tumors with HISSNP administration. Reproduced from ref. 41 with permission from Wiley-VCH, Copyright 2018.

Fig. 3