. 2020 Jun 18;12(10):3379–3392. doi: 10.1039/d0sc02925d

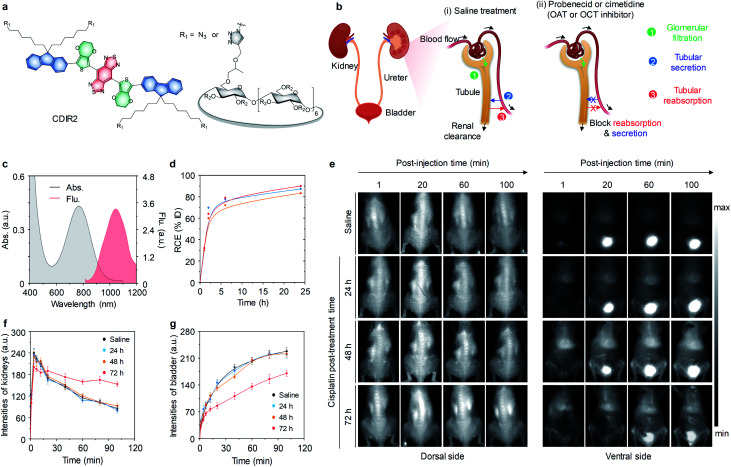
Fig. 4. (a) Chemical structures of CDIR2 (R2 = H or CH2CHOHCH3). (b) Schematic illustration of a nephron structure and renal clearance pathways including glomerular filtration, tubular secretion and tubular reabsorption. (c) Absorption and fluorescence spectra of CDIR2 in PBS (10 mM, pH 7.4). (d) RCE as a function of time post-injection of CDIR2 in living mice. The three lines represent the measurements in three independent mice. (e) Representative NIR-II fluorescence images of living mice after intravenously injection of CDIR2 (1 mmol per kg body weight) at different post-treatment time points (24, 48 or 72 h). The control groups were treated with saline. (f and g) The dynamic NIR-II fluorescence intensities of the kidneys and bladder as a function of time post-injection of CDIR2 in living mice treated with saline or cisplatin at different post-treatment time points. Reproduced with permission from ref. 66. Copyright 2019 John Wiley and Sons.

Fig. 4