. 2020 Jun 18;12(10):3379–3392. doi: 10.1039/d0sc02925d

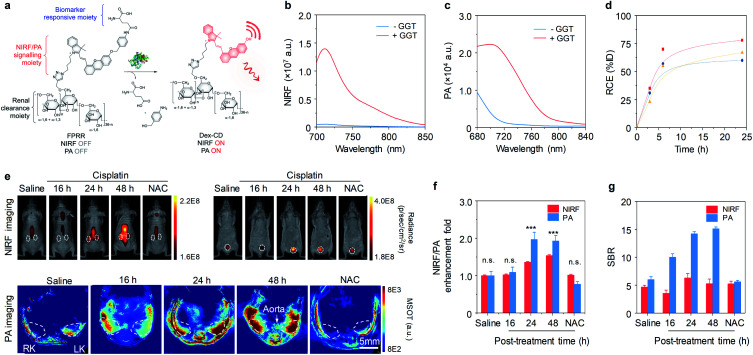
Fig. 6. (a) Chemical structures and molecular mechanism of FPRR for NIRF and PA imaging of AKI. (b and c) Fluorescence and PA spectra of FPRR (25 μM) in the absence or presence of GGT (20 μg) in PBS buffer (10 mM, pH 7.4). (d) RCE as a function of time post-injection of FPRR in living mice. The three lines represent the measurements in three independent mice. (e) Representative NIRF images of living mice at 60 min and PA images (700 nm) of mice transverse section at 120 min after injection of FPRR (6.5 μmol per kg body weight) at different time points (0, 16, 24 or 48 h) post-treatment of cisplatin (20 mg per kg body weight). For NAC-protected mice, real-time imaging was conducted at 48 h post-cisplatin treatment. The white circles indicate the site of kidneys and bladder, respectively. NIRF images acquired at 720 nm upon excitation at 675 nm. RK, right kidney; LK, left kidney. (f) Relative NIRF and PA signals enhancement of the kidneys for different treatment groups. (g) Comparison of SBRs between NIRF and PA imaging. n.s.: not significant. *p < 0.05, **p < 0.01, ***p < 0.001. Reproduced with permission from ref. 58. Copyright 2020 John Wiley and Sons.

Fig. 6