. 2020 Jun 18;12(10):3379–3392. doi: 10.1039/d0sc02925d

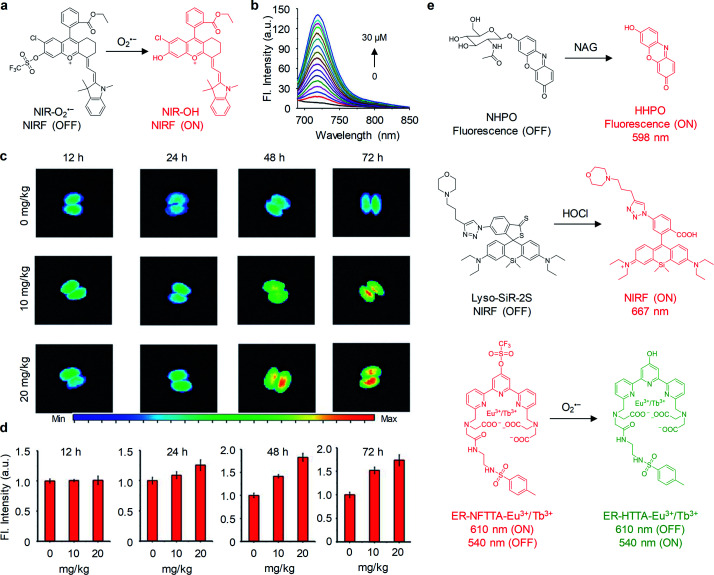
Fig. 7. (a) Chemical structures of NIR-O2˙ and its activation form in response to O2˙. (b) Fluorescence spectra of NIR-O2˙ (5 μM) in PBS (25 mM, pH 7.4) upon addition of O2˙ (0–30 μM). (c) Representative NIRF images of excised kidneys from mice treated with different doses of cisplatin (0, 10 and 20 mg kg−1) at different post-treatment time points (12, 24, 48 and 72 h). (d) NIRF intensities of the kidneys in panel of c. (e) Chemical structures of probes NHPO, Lyso-SiR-2S and ER-NFTTA-Eu3+/Tb3+ and their activation forms in response to NAG, HClO and O2˙, respectively. Reproduced with permission from ref. 59. Copyright 2018 Royal Society of Chemistry.

Fig. 7