. 2021 Jan 14;12(10):3615–3626. doi: 10.1039/d0sc05879c

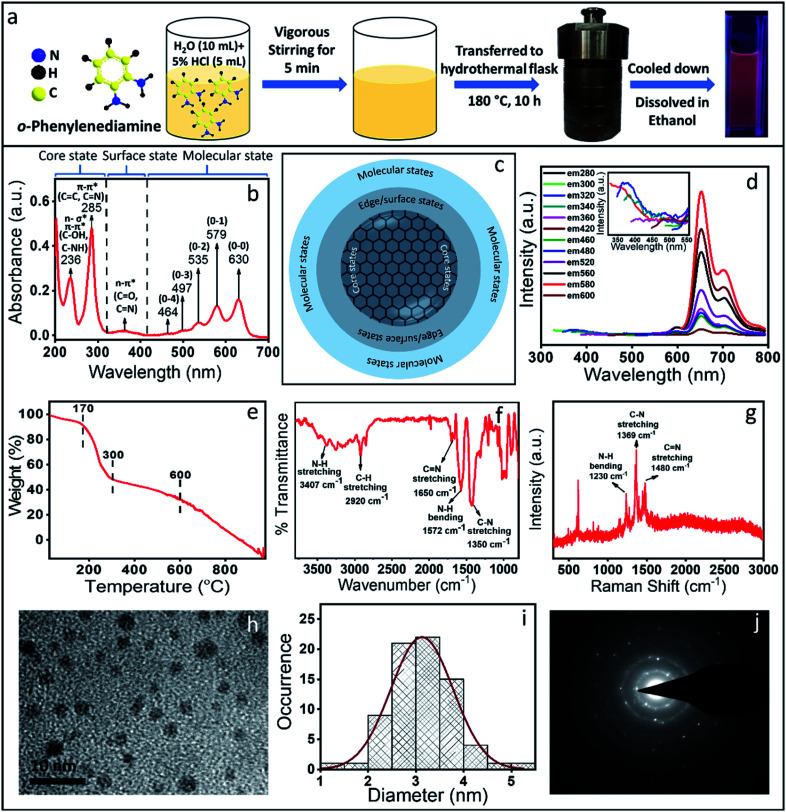
Fig. 1. (a) Schematics of the synthesis of the red emissive CNDs using OPDA as a precursor molecule. (b) Absorption spectrum of the synthesized crude sample showing the core state, surface state and molecular state transition. (c) Schematic of a commonly accepted CND structure. (d) Fluorescence emission spectra of the red emissive CNDs show excitation independent emission; the inset shows the excitation dependent emission in the blue region. (e) TGA data show at least two species with different thermal stability. (f) FTIR spectrum with the designated vibrational modes. (g) Raman spectrum shows the signature of normal vibrational modes with no signature of D and G bands which are typically observed in graphitic material. (h & i) TEM image and the corresponding size distribution. The average size obtained was ∼3 nm. (j) SAED pattern confirming the polycrystalline nature of the CNDs with a d-spacing of 0.26 and 0.45 nm, which do not match with graphitic 001 or 002 planes.

Fig. 1