. 2021 Jan 14;12(10):3615–3626. doi: 10.1039/d0sc05879c

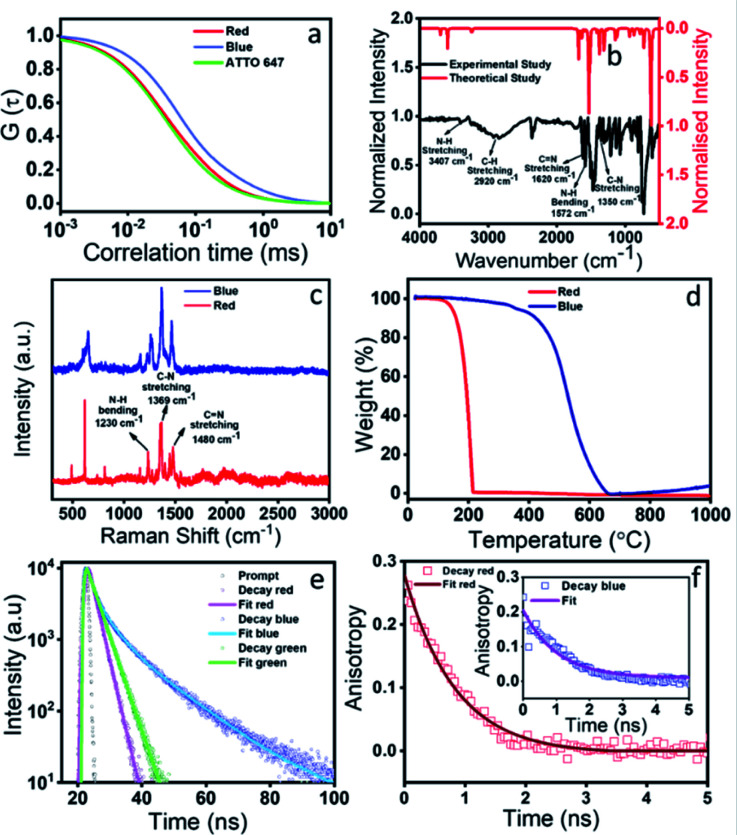
Fig. 4. Detailed characterization of red and blue components. (a) FCS data show that the autocorrelation curve of the red emissive component is very similar to that of the ATTO 647 dye. This suggests a molecular fluorophore like signature of the red emissive component with a size of 0.6 nm. The blue emissive component has a much slower autocorrelation decay curve that corresponds to a size of ∼6 nm. (b) Experimental and theoretical simulated FTIR spectra of the red component. The fingerprint region shows similarity in the vibrational bands, especially the highly intense C Created by potrace 1.16, written by Peter Selinger 2001-2019 N, N–H, and C–N stretching modes. (c) Raman spectra of both blue and red components show very high similarity of the vibrational bands. No signature of D and G bands for the graphitic material is observed. (d) TGA data show that the red component loses its mass within 200 °C, while the blue component shows thermal degradation only after 500 °C. (e) Lifetime data of both blue and red components. The blue component has a much higher lifetime in comparison to the red component, thus suggesting higher radiative decay for the blue component. (f) Anisotropy decay of the red emissive component and (inset) blue component. The rotational correlation time was found to be much larger in the blue component suggesting its larger size in comparison to the red component.

Fig. 4