. 2021 Jan 22;12(12):4345–4352. doi: 10.1039/d0sc05718e

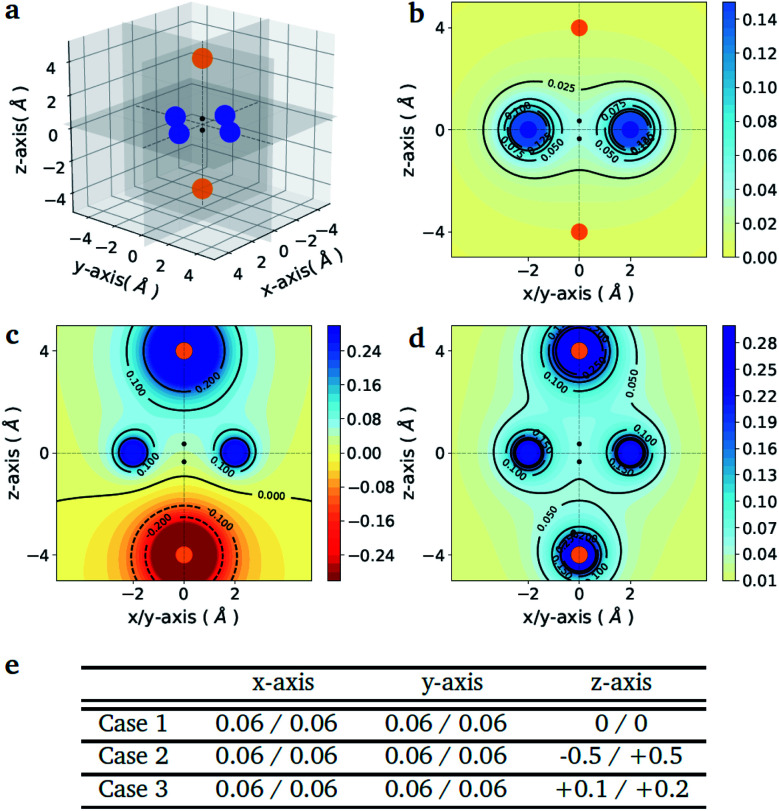
Fig. 1. Point charge distributions. (a) Position of the point charges (blue and orange dots) relative to the molecule to optimize (black dots). Shown is the case of the H2 molecule. The orange charges along z-axis are allowed to change (values reported in panel (e)) whereas the blue charges are kept fixed at the value of 0.06. (b–d) Contour plots of the potential energy generated by the 6 point charges in the xz plane for the three different cases given in the table below (panel e). The potentials are in atomic units. (e) Value of the charges (in the unit of the fundamental electronic charge e) used to generate the 3 different external potentials. For all molecules (A1–A2) in Fig. 2 (panel e) the first atom (A1) is the one with negative z-coordinate.

Fig. 1