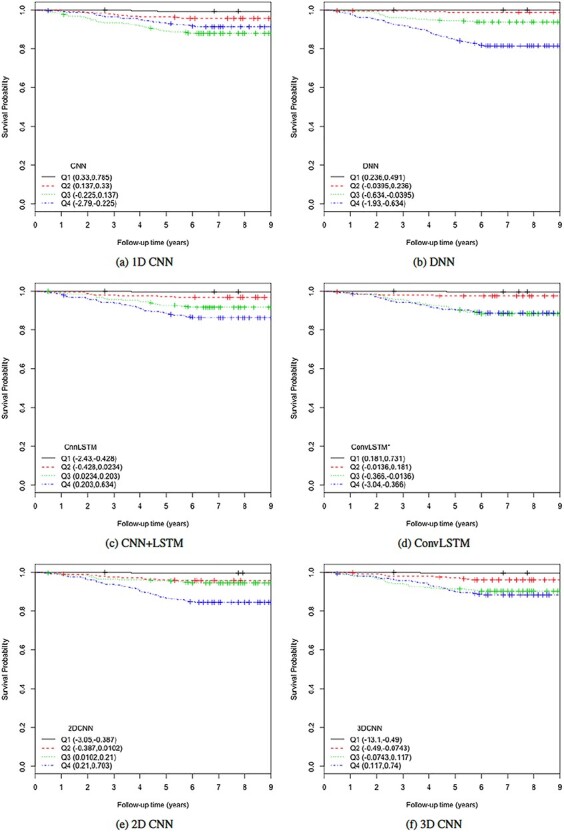
Figure 4.

The KM curves for estimated BAs using six DL architectures on physical activity data applying  for estimated BAs. Q1, Q2, Q3 and Q4 denote 1st, 2nd, 3rd and 4th quartiles, respectively.

The KM curves for estimated BAs using six DL architectures on physical activity data applying  for estimated BAs. Q1, Q2, Q3 and Q4 denote 1st, 2nd, 3rd and 4th quartiles, respectively.