
Table 8.
Log rank results applying the normalized BA acceleration (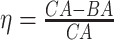 ) for different SBSI categories using anthropometric data and biomarker data, respectively. Q1, Q2, etc. denote 1st quartile, 2nd quartile, etc.
| DL architecture |

|

|

|

|
||||
|---|---|---|---|---|---|---|---|---|
| Chi-sq | P-value | Chi-sq | P-value | Chi-sq | P-value | Chi-sq | P-value | |
| Anthropometry | ||||||||
| CNN | 86.81 | 2.03E-16 | 219.15 | 1.92E-15 | 305.79 | 2.07E-14 | 727.11 | 3.03E-16 |
| DNN | 9.58 | 0.02 | 40.23 | 9.52E-09 | 10.96 | 0.01 | 36.93 | 4.77E-08 |
| Biomarkers | ||||||||
| CNN | 130.63 | 1.29E-16 | 159.84 | 4.03E-11 | 317.14 | 2.29E-13 | 764.68 | 7.03E-12 |
| DNN | 15.63 | 0.001 | 32.68 | 3.75E-07 | 108.06 | 0.00 | 340.97 | 0 |