. 2021 Mar 17;12(15):5655–5663. doi: 10.1039/d0sc06061e

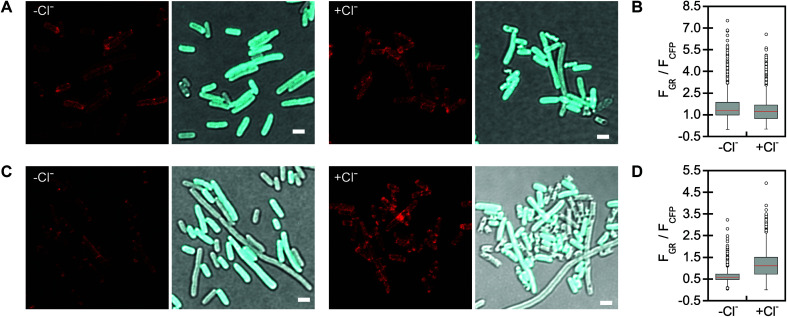
Fig. 6. Molecular imaging shows that GR1–CFP is a fluorescent chloride sensor at the single cell level in live E. coli. Representative confocal fluorescence microscopy images of E. coli expressing (A) wtGR–CFP and (C) GR1–CFP immobilized on 1.5% agarose pads containing 0 mM and 400 mM sodium chloride in 50 mM sodium acetate buffer at pH 5. Images are shown for the rhodopsin in red (left) and an overlay of the CFP in cyan with the transmitted light image (right). Scale bar = 2 μm. Single-cell analysis of the normalized emission response to 400 mM sodium chloride for (B) wtGR–CFP (for 0 mM chloride n = 2829 regions of interest (ROIs); for 400 mM chloride n = 3818 ROIs) and (D) GR1–CFP (for 0 mM chloride n = 1890 ROIs; for 400 mM chloride n = 2913 ROIs). The median fluorescence intensity of the rhodopsin (FGR) was normalized to the median fluorescence intensity of CFP (FCFP). Boxplots represent the analysis for all cells in the fields of view with the lower and upper quartile data enclosed by the gray box. The median values are indicated by the red line, and the minimum and maximum values for each data set are indicated by the lines extending below and above the gray box. Data points that fall outside of these parameters are considered outliers and are shown as open circles. At least four different fields were analyzed for each biological replicate (n = 3).

Fig. 6