. 2021 Feb 12;12(13):4661–4682. doi: 10.1039/d0sc06878k

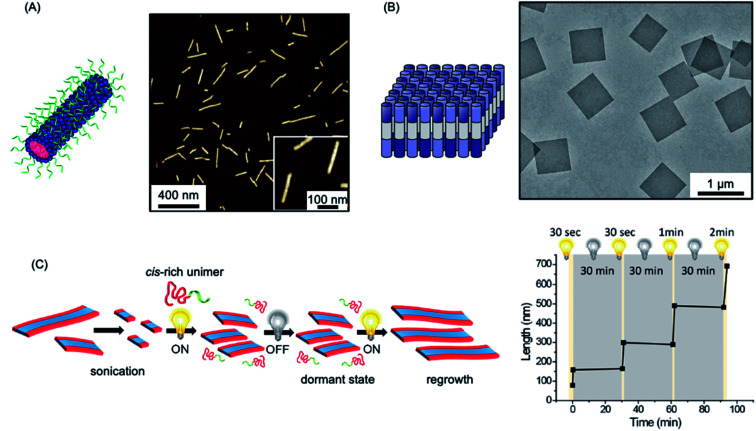
Fig. 4. Further examples of living CDSA. (A) Schematic illustration and AFM image of 1D nanofibers comprised of amphiphilic DNA conjugates. Pink = cyanine 3 (Cy3) dyes, blue = hexaethylene chains, green = 19-mer DNA strands. (B) Schematic illustration and TEM image of 2D platelet nanostructures from the self-assembly of collagen-mimetic peptides. (C) Schematic illustration of controlled fiber formation by the living light-induced CDSA of PPV BCPs. The plot shows the increase in average fiber length over time, highlighting sample illumination times. Panel (A) reproduced from ref. 182. Panel (B) reproduced from ref. 183. Panel (C) reproduced from ref. 184.

Fig. 4