. 2021 Mar 3;12(14):5196–5201. doi: 10.1039/d1sc01044a

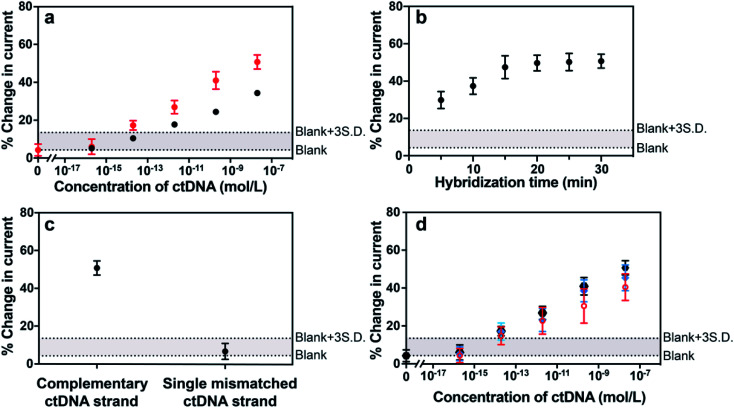
Fig. 4. (a) Hybridization-induced change in the SWVs after exposing the sensor to different concentrations of complementary ctDNA target (101 nucleotides) wherein the probe DNA hybridized to the 3′ end (red data points) and the middle (black data points) of the ctDNA. (b) Effect of hybridization time after exposing the sensor to 20 nM complementary ctDNA target (101 nucleotides) on the SWV current change. (c) Hybridization-induced change in the SWVs after exposing the sensor to complementary and single mismatched circulating tumor DNA target sequences. (d) Hybridization-induced change in SWVs after exposing the sensor to different concentrations of complementary ctDNA target (101 nucleotides) spiked in phosphate buffered saline (black data points), human plasma (blue data points) and 50% human blood (red data points). Two dash lines are provided to indicate the levels of the average blank and the three times standard deviation above the averaged blank. Error bars represent standard deviations from at least 5 independent experiments.

Fig. 4