. 2021 Mar 9;12(15):5555–5565. doi: 10.1039/d1sc00186h

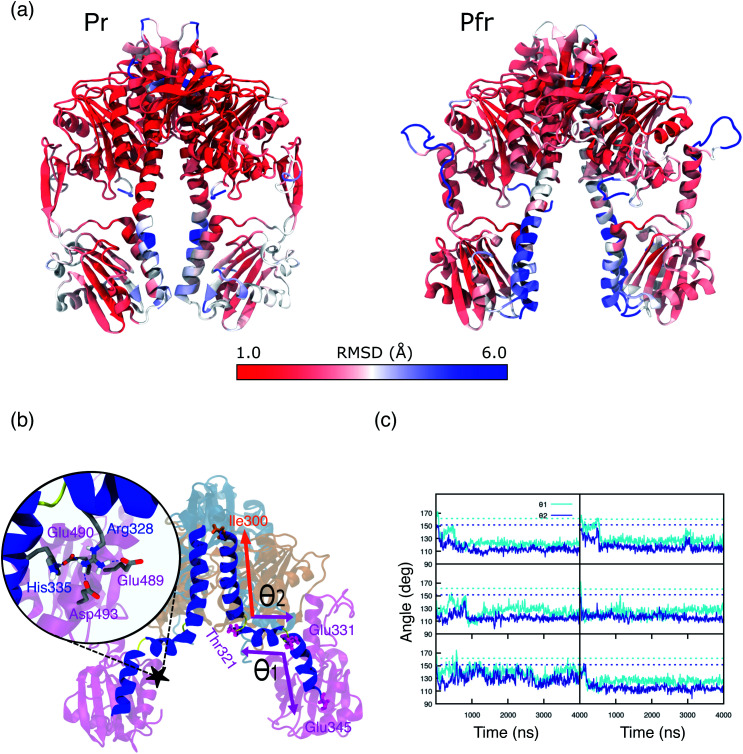
Fig. 5. (a) Representation of Pr (left panel) and Pfr PSM (right panel). Colors are indicative of the MD-averaged RMSD value of each residue using as a reference the crystal geometry. The RMSD was calculated aligning each monomer separately to the one of the crystal structure. (b) MD-representative structure for the DrBph photo-sensory module (PSM) in the Pfr form. The spine-angles formed between residues Thr321, Glu331, Glu345 (θ1) and Ile300, Thr321, Glu331 (θ1) are indicated. The color scheme is the same as used in Fig. 1. The zoom-in shows the salt bridges and H-bond interactions between the spine and the PHY domain. (c) Spine-angles θ1 and θ2 are analyzed along the simulation time for Rep1, Rep2, Rep3 (from top to bottom) and separately for monomer A and monomer B (left and right). The dashed lines indicate the crystal chain A and chain B values for θ1 (∼160°) and θ2 (∼150°), which correspond to the initial structures for monomer A and monomer B, respectively.

Fig. 5