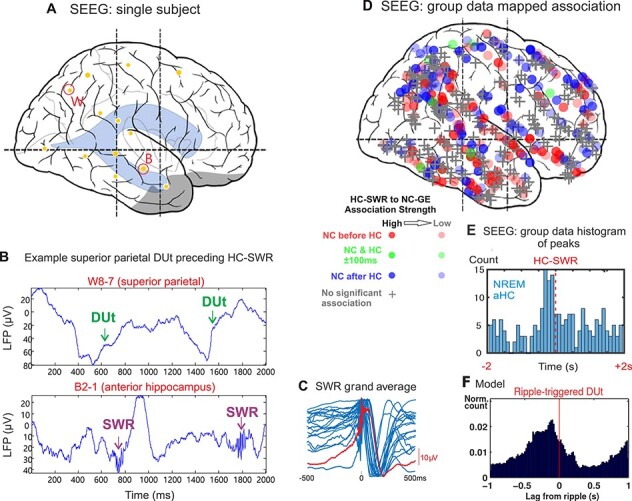
Figure 3 .

Experimental data and model prediction. A. Position of hippocampal (B) and parietal (W) electrodes in the example subject B. Top. Raw LFP trace (transcortical bipolar SEEG derivation) from an example parietal lobe electrode showing alternating Up/Down-states with the Down to Up transition (DUt) marked. Bottom. Raw LFP trace from depth electrode (bipolar SEEG) from the anterior hippocampus, showing sharpwave-ripples following DUt at the top panel. C. The blue waveforms are the template averages for the SWR in the 17 aHC sites. They range in amplitude from 35-300  V peak-to-peak and are normalized for display. The red waveform is the grand average. D. Locations of the NC electrodes where DUt were detected to correlate with HC SWR. Shape codes if there was a significant temporal relationship (circle: significant, +: not significant); color codes order (red: DUt before SWR; blue: SWR before DUt; green: within 100ms); intensity codes association strength. Significant associations are evident in all cortical areas sampled. E. The number of NC-HC electrode-pairs with peak DUt-SWR association latency in each 100ms bin around the time of the SWR is plotted. F. DUt-triggered ripple histogram for the model. To get a smooth distribution, the transition event in each cell is measured separately. Red vertical line -
  ms.
ms.
