. 2021 Mar 18;12(16):5720–5736. doi: 10.1039/d0sc07085h

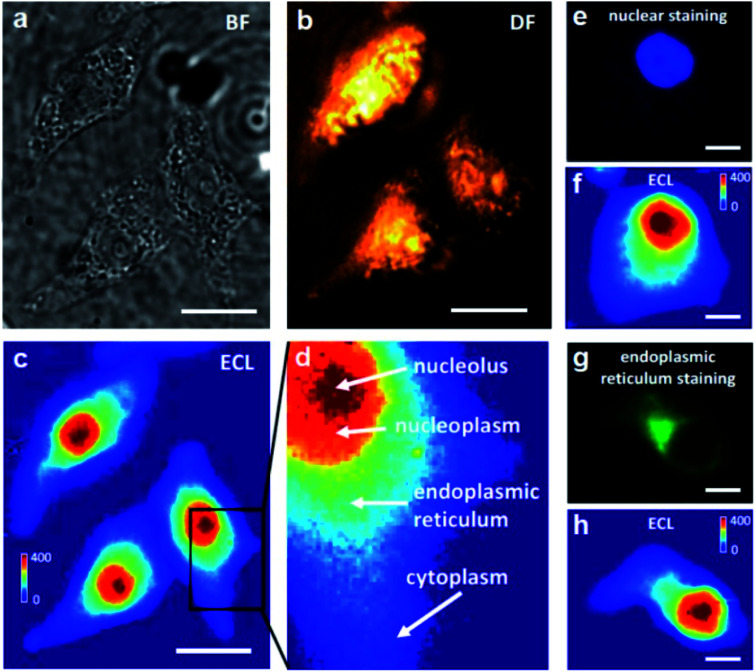
Fig. 13. Bright-field (BF) (a), dark-field (DF) (b) and ECL (c) images of three adherent and fixed HeLa cells on an ITO electrode. The BF and DF images were captured using transmission and oblique incidence light sources, respectively. When a constant 1.3 V (vs. Ag/AgCl) was applied to the ITO electrode in 10 mM PBS (pH 7.4) containing 400 μM Ru(bpy)32+, frame-by-frame ECL sequence images (exposure time: 1 s) were recorded on the EMCCD and an integrated ECL image of 400 original ECL serial images is shown in (c). Scale bar (white) is 20 μm. (d) A zoom-in ECL image of a single cell marked with the black box in (c). The red, orange, cyan and blue regions represent the nucleolus, nucleoplasm, endoplasmic reticulum and cytoplasm, respectively. (e, f) Fluorescence image of nuclear staining with DAPI and the corresponding ECL image. (g, h) Fluorescence image of endoplasmic reticulum staining and the corresponding ECL image. Scale bar (white) is 5 μm. Reproduced from ref. 111 with permission from Wiley-VCH, copyright [2021].

Fig. 13