. 2021 Mar 18;12(16):5720–5736. doi: 10.1039/d0sc07085h

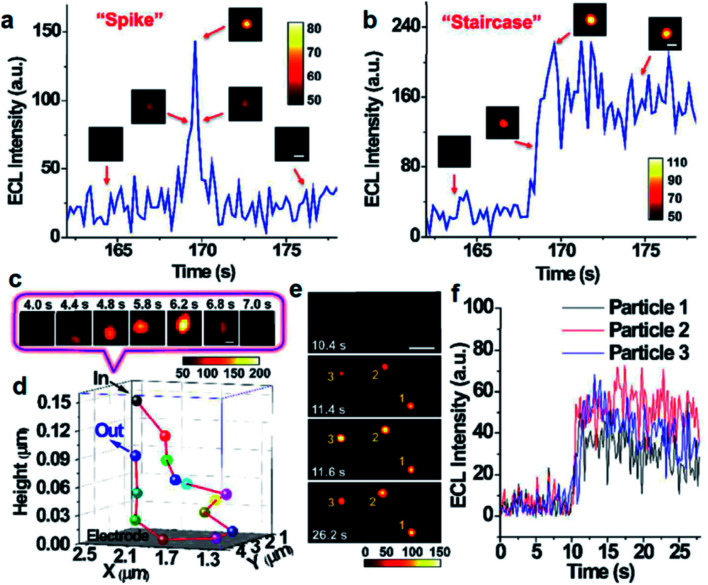
Fig. 6. Single ECL spike (a) and staircase (b) signals during the collisions processes. (insets) ECL snapshots of individual nanoparticles during a typical collision process. Constant potential: 1.4 V. Scale bars (white), 2 μm. Exposure time: 0.2 s. (c) ECL snapshots of individual nanoparticles during an elastic collision with Brownian motion. Scale bars (white), 1 μm. Exposure time: 0.2 s. (d) 3D collision trajectory of single nanoparticle in (c). (e) ECL snapshots of three RuDSNs colliding with the electrode simultaneously. Scale bars (white), 5 μm. Exposure time: 0.2 s. (f) ECL intensity vs. time curves of three RuDSNs in (e). Reproduced from ref. 70 with permission from the Royal Society of Chemistry, copyright [2018].

Fig. 6