. 2021 Mar 18;12(16):5720–5736. doi: 10.1039/d0sc07085h

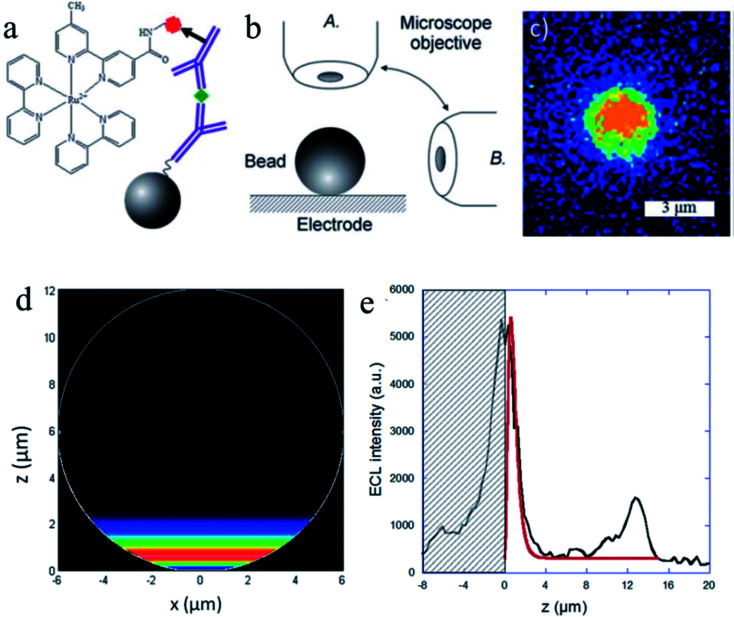
Fig. 9. (a) Sandwich immunoassay with PS beads. (b) Schematic representation of both of the optical configurations used to image the functionalized bead: top-view (A) and side-view (B). (c) ECL imaging of a single 3 μm bead using the top-view configuration. ECL images were acquired over a 6 s exposure-time at a potential of 1.1 V vs. Ag/AgCl/KCl in a PBS solution containing 100 mM TPrA (pH = 7.4). (d) Side-view of the simulated distribution of the generated Ru(bpy)32+* excited state (i.e. ECL intensity) on the surface of a 12 μm bead. (e) Comparison of the experimental (black line) and simulated (red line) ECL intensity profiles at the level of a single bead. The experimental data correspond to the PS bead in Fig. 3a recorded at 1.1 V. The ECL signals are simulated with a value of 2920 s−1 for the TPrAc+ deprotonation rate constant. The hatched zone represents the reflection of the ECL light on the electrode surface. Reproduced from ref. 87 with permission from the Royal Society of Chemistry, copyright [2014].

Fig. 9