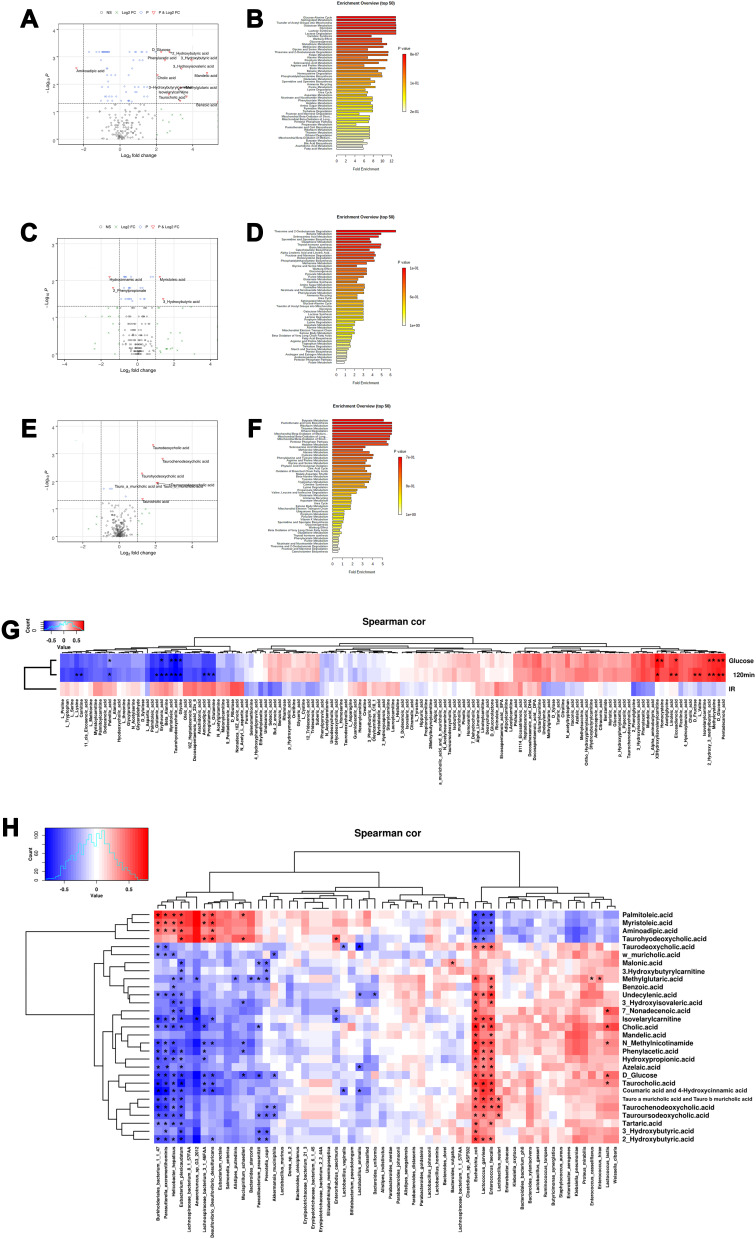
Figure 6.
Comparative analysis of serum metabolomics in the mice. (A) Volcano plot and (B) metabolite pathway enrichment analysis of the differential serum metabolomics between normal mice and T1DM mice treated with vehicle. (C) Volcano plot and (D) metabolite pathway enrichment analysis of the differential serum metabolomics between vehicle-treated normal mice and CA-treated normal mice. (E) Volcano plot and (F) metabolite pathway enrichment analysis of the differential serum metabolomics between vehicle-treated T1DM mice and CA-treated T1DM mice. (G) The correlation between serum metabolomics and glucose/insulin levels were determined by Spearman correlation analysis. (H) The correlation between serum metabolomics levels and gut microbiota abundance were determined by Spearman correlation analysis.
Abbreviations: FC, fold change; NS, non-significant; Spearman cor, Spearman correlation.

